DOI: 10.1145/1518701.1518810 | CITEULIKE: 4278605 | REFERENCE: BibTex, Endnote, RefMan | PDF ![]()
Bartneck, C., & Hu, J. (2009). Scientometric Analysis Of The CHI Proceedings. Proceedings of the Conference on Human Factors in Computing Systems (CHI2009), Boston, pp 699-708. | DOI: 10.1145/1518701.1518810
Scientometric Analysis Of The CHI Proceedings
Department of Industrial Design
Eindhoven University of Technology
Den Dolech 2, 5600MB Eindhoven, NL
christoph@bartneck.de, j.hu@tue.nl
Abstract - The CHI conference has grown rapidly over the last 26 years. We present a quantitative analysis on the countries and organizations that contribute to its success. Only 7.8 percent of the countries are responsible for 80 percent of the papers in the CHI proceedings, and the USA is clearly the country with most papers. But the success of a country or organization does not depend only on the number of accepted papers, but also on their quality. We present a ranking of countries and organizations based on the h-index, an indicator that tries to balance the quantity and quality of scientific output based on a bibliometric analysis. The bibliometric analysis also allowed us to demonstrate the difficulty of judging quality. The papers acknowledged by the best paper award committee were not cited more often than a random sample of papers from the same years. The merit of the award is therefore unclear, and it might be worthwhile to allow the visitor to the conference to vote for the best paper.
Keywords: quality, bibliometrics, chi, history, h-index, g-index
Introduction
The SIGCHI conference on human factors in computing systems (CHI) is one of the most important conferences in the area of human–computer interaction (HCI). It was started in 1982, although a preliminary conference took place a year earlier, and at the 2008 conference in Florence two invited sessions looked back at the history of the conference. John Karat and Manfred Tscheligi hosted the session “From Usability To User Experience: What Has Really Changed In Practice In The Last 25 Years”, and Bonnie John chaired the “Celebrating The Psychology Of Human-Computer Interaction” session. Two previous studies investigated the changes in evaluation methods used in studies that are published in the CHI conference [1, 2] and two studies tried to cluster CHI papers into categories [3, 4]. These studies inspired us to go beyond an anecdotal account of the history of CHI, and present a quantitative analysis of the CHI conference. We therefore use the conference’s proceedings as the basis for our analysis, since it is the official record. What has really changed over the last 25 years and who has contributed to the conference’s success? How strong is the obvious US supremacy in reality? The CHI conference as it is today has not always existed. One danger of not knowing the history of the CHI conference is that what happens at the conference begins to appear as timeless and natural. History allows us to begin to see the kinds of choices that have been made and the particular biases and possibilities that resulted from these choices.
Two indicators might help to shed light on the distribution of papers across countries and organizations: the Pareto Principle and Lotka’s law. The Pareto Principle, named after the Italian sociologist, economist, and philosopher Vilfredo Federico Damaso Pareto, is also known as the rule of 80/20. It states that in many cases 80 percent of the effects come from 20 percent of the causes. Garfield suggested that this principle also applies to citations in that 20 percent of articles may account for 80 percent of the citations [5]. Does the Pareto Principle also apply to the countries, organizations, and papers in the CHI proceedings? Do 80 percent of the papers come from only 20 percent of the organizations?
Lotka [6] described a frequency distribution of scientific productivity in which the number of authors making n contributions is about 1 / na of those making one contribution, where a nearly always equals two. The general formula says: y = c / xn, where x is the number of publications, y the relative frequency of authors with x publications, and n and c are constants depending on the specific field (n is usually 2). Of course we cannot apply Loka’s law to the authors in the CHI proceedings, because even the most successful authors within the CHI conference have only a handful of papers accepted. More interesting is whether Lotka’s law applies to countries and organizations involved in the CHI conference?
Besides these two indicators for the distribution of papers, we are interested in the judgments made of the quality of papers and organizations. During our own visits to the conference, we were sometimes surprised how certain papers had made it into the conference and how certain excellent papers received only little attention from the audience.
In a multidisciplinary field such as this, assessing the quality of a manuscript for the CHI conference is difficult since the different groups operate under different paradigms [7, 8]. The peer-review process tries to judge the quality before the actual publication, but it is well known that the process is not without problems [9-12]. In a controversial study, Peters and Ceci [13] altered published articles to disguise their origin, and resubmitted them to the journals that had originally published the manuscripts. Most altered papers were not recognized and were rejected on supposed "scientific grounds." The original article is only eight pages long, but it evoked a discussion in the open peer commentary of 59 pages. The discussion illustrates that the peer-review system is of high relevance to the research community and that it is a heated topic.
Several attempts have been made to evaluate the quality of the review process, but one conceptual problem remains. For a complete analysis it is necessary to also consider the rejected papers. This information is usually not available from the ACM, and hence we are not able to compare the success of the accepted papers with the success of the rejected papers.
However, the best paper award allows us to analyze nominees, winners, and non‑winners. It is not known whether the best paper award committee is following the strict blind peer review process, but our guess is that this is unlikely. Still, they make an honest effort to select “excellent” papers and they probably take the results of the review process into account. Since 2004, the nominees and award winners are indicated in the conference brochure, and hence we focus on the years 2004-2008.
The judgments made of the quality of papers does not stop with their publication. Increasingly, bibliometric indicators, such as the impact factor, are being used to judge the quality of researchers, journals, and organizations [14, 15]. Thomson Reuters, on the basis of the groundbreaking work of Eugene Garfield and his company, Institute for Scientific Information (ISI), publishes the annual Science Citation Index (SCI), as well as the Social Sciences Citation Index (SSCI) and the Arts and Humanities Citation Index (AHCI). They list the impact factor of leading scientific journals, based on a bibliometric analysis. The impact factor brings a useful measure of objectivity into the evaluation process at relatively low financial cost [16]. These indexes have been used to judge the quality of the journals, but the database has also been used for other bibliometric analyses.
The performance of researchers and their organizations in the United Kingdom will be evaluated officially in the 2008 Research Assessment Exercise (REA) with the help of bibliometric indicators. ACM also started in 2008 to list citation counts for the articles in its digital library. But bibliometric analysis is also facing criticism. The interested reader may consult MacRoberts & MacRoberts [17], who reviewed common objections to bibliometric analysis, and grouped them into: (in)formal influences are not cited, citations are biased, self citations, different types of citations, variation in citation rate with type of publication, nationality, time period, size and type of specialty, and technical limitations. An example of a citation bias is that not every citation is made to positively acknowledge previous work. Lawrence [18] pointed out that bibliometric indicators are now so widely adopted that they force scientists to change their primary goal from making discoveries to publishing as many papers as possible in high impact factor journals. As a result the utility, quality and objectivity of articles has deteriorated.
The debate between supporters and critics of bibliometric analysis continues. Meanwhile, improvements to the methodology of bibliometrics are being developed. It can be concluded that, despite certain conceptual and methodological problems, bibliometric analysis is a useful tool. The representative body for the executive heads of UK universities (UUK) considers bibliometric indicators “… probably the most useful of a number of variables that could feasibly be used to create a metric of some aspect of research performance” [19].
A fundamental question of all bibliometric analysis is on what data the analysis is based. Eugene Garfield spearheaded the analysis with his Institute for Scientific Information (ISI), and remained unchallenged for many years. In 1997, Katz and Hicks proclaimed the arrival of Desktop Bibliometrics [20]. Technological advances, partly based on ISI’s Web of Science (WOS), would move bibliometric studies “from the realm of the privileged few with access to mainframe and minicomputers to the desktop of researchers equipped with personal computers”. The development of Elsevier’s Scopus and Google Scholar (GS) surpassed their predication. Moreover, GS provides free access to bibliometric data that may lead to more transparency in tenure reviews, funding, and other science policy issues, as it allows citation counts, and analyses based thereon, to be performed and duplicated by anyone [21]. Today, everybody can use software, such as “Publish or Perish”, to perform a simple bibliometric analysis within minutes on the basis of data attained from GS.
However, GS has also received criticism [22-24]. In response to Jacso’s studies, Harzing and Wal tried to reproduce most of the GS failures that Jacso had reported, but were not able to do so reliably [25]. We may conclude that some of the issues raised by Jacso may have been valid at that time, but that GS continues to improve its service, and many practical problems have been overcome by now.
There are also other reasons that make GS the preferred data source for a bibliometric analysis of the CHI proceedings. GS far surpasses WOS and Scopus in its coverage of conference proceedings as well as of international, non-English language journals [26]. Conference proceedings are an essential publication channel for HCI research, and hence GS provides the necessary coverage for a bibliometric analysis of the CHI proceedings. To illustrate the power of GS, we performed a small test. We searched for the relatively unknown publications of “C Bartneck”, since he has a unique name. WOS found 7 publications, Scopus 23 and GS 67. The GS results are closest to the accurate value of 81. A similar search for “DA Norman” resulted in 32 publications listed in WOS, 41 in Scopus, and 658 in GS. Clearly, GS offers the coverage we require to analyze the HCI community.
An even stronger argument for GS is that neither WOS nor Scopus fully index the CHI proceedings at present. Scopus only includes the CHI proceedings from 1992 onwards, and focuses on the main proceedings. The extended abstracts are not included for all years. Thomson Reuter reacted to its lack of coverage of conference proceedings by releasing its ISI Proceedings service, but this indexes only the years 2002 and 2005 of the CHI proceedings.
However, a bibliometric analysis does allow us to reconsider the judgment of the supremacy of countries and organizations. Clearly, not only the sheer number of accepted papers is important, but also their quality, expressed through their citation count. Jorge E. Hirsch proposed the h-index to characterize the scientific output of a researcher or organization [27]. It balances the quantity and quality of papers. The calculation of the h-index can best be described by a concrete example. A researcher has an h‑index of eight if he/she has at least eight publications that each has been cited at least eight times. The h‑index thereby takes the quantity and quality of papers into account at the same time.
There is a catch in calculating the h‑index for countries and organizations. The authors of a certain paper can belong to different organizations and countries. Let us assume that country x has 0.5 credits for papers that have exactly 1 citation, 1.33 credits for papers that have exactly 2 citations, and 2 credits for papers that have exactly 3 citations. We then calculate
s1 = ⌊ 2 + 1.33 + 0.5 ⌋ = 3,
s2 = ⌊ 1.33 + 0.55 ⌋ = 1
and s3 = ⌊ 0.55 ⌋ = 0.
It follows that s1 > s2 > s3. Country x has at least one paper that has at least one citation ((s1=3)>1). However, it does not have at least two papers that have at least two citations ((s2=1)<2). The h‑index for country x is therefore 1. We used the same principle to calculate the h‑index for organizations.
The popularity of the h-index may stem from its simplicity and its robustness against large numbers of barely cited articles. However, in the same way that it is robust against the long tail of non-cited papers, it is also immune to the effects of highly cited papers. To use the above example, it does not matter anymore if the eight papers that are above the threshold of eight are being cited 8, 80, 800, or even 8000 times. The g-index maintains the h-index robustness against infrequently cited papers, while taking into account highly cited papers [28]. Egghe defines the g‑index as the (unique) largest number such that the top g articles received (together) at least g2 citations. Let us use the example of country x again. Country x has at least one paper that has at least 12 citations ((s1=3)>1). However, it does not have at least two papers that have at least 22 citations ((s2=1)<4). The g‑index for country x is therefore 1.
We are interested in comparing these two indices with the bare quantitative indicator of the number of accepted papers. Does the ranking order for organizations change when we sort them by the number of accepted papers, the h‑index or the g‑index?
In summary, besides presenting a historical perspective and rankings, we focus on a bibliometric analysis. The latter offers a method, although not undisputed, for evaluating the quality of papers and organizations. In particular we are interested in which countries and organizations are most successful in the CHI conference and what indicators might be most useful for the ranking. We are also interested whether the best paper award truly acknowledges excellence.
Data Processing
The ACM made the complete meta-data of the CHI proceedings available to us in an XML format. A first review of the XML data revealed that the structures of various XML files were inconsistent. We used the Map Force software to import the different XML files into one consistent relational database. Notice that there was no CHI conference in the year 1984, and hence no data is available for that year.
Authors
A closer inspection of the data revealed that the identification numbers of authors were inconsistent. The same author could appear several times with different identification numbers. Moreover, the authors themselves used inconsistent names. William Buxton, for example, is also listed as “W. Buxton” or “Bill Buxton”. To make the situation even more confusing, he also worked for different organizations. We therefore used the FuzzyDupes software to group the aliases of authors together and to give them truly unique identification numbers. However, this process can never be perfect. Persons with the same name and different affiliations could indeed be two different authors. But the same author might have moved from one organization to the other, or be working for both organizations at the same time. It is also possible that two authors with exactly the same name work for the same organization. This problem might be difficult to overcome, and the market leader for bibliometric analyses, Thomson Reuter (Web Of Science, WOS), recently introduced the “Researcher ID” to help in identifying unique authors. The ACM also introduced the “Author Profile Pages” with the very same intention. Both systems use normalization algorithms to identify unique authors, but both systems also rely on the contributions of the researchers themselves. The problem remains difficult, and we therefore focus our statistics on the organization and country level, and less on the individual author.
Affiliations
We discovered that the information about the affiliations of the authors was messy. 705 records of the 17,610 (4%) did not include any affiliation information. A closer analysis of the missing affiliations revealed that almost all affiliations for the main proceedings in the years 1981, 1982, and 1992 were missing. It is unclear why this information is not available in the XML files provided by the ACM or in the actual ACM Digital Library. The PDF themselves include this information.
We also discovered that all the information about the authors’ affiliations has been stored in one field. This contains the name and the address of the organization. A direct analysis was therefore not possible. Moreover, misspelled names were common, even from authors associated to “Standford”. The names of the affiliations could also occur in different forms, in particular for non-English organizations. For example, the Eindhoven University of Technology appears in at least six versions: Eindhoven University of Technology, Technical University of Eindhoven, Technische Universiteit Eindhoven, TU Eindhoven, TUE, and TU/e. Sometimes authors even included more than one affiliation. In that case, we used the first affiliation mentioned.
FuzzyDupes was not able to group the affiliations by itself, since the affiliation field was far too inconsistent. We therefore resorted to a semi-automatic procedure. We first compiled a list of 3000 acknowledged universities and institutes. We then performed a precise match between the known names of organizations and the affiliation field. Approximately half of the records could be matched in this way.
We then increased the number of matches by including variations of the known names, and by adding 34 universities, 36 institutes, and 111 companies to our list of known organizations. We paid extra attention to records that included a university affiliation, and were able to match all of them in this way. The remaining 1247 records contained affiliations to minor companies and institutes. We manually classified 84 records as institutes, based on the fact that their affiliation contained the word “institute”. We did not include these institute names in the list of known organizations. The remaining 1163 records were classified as companies. We would like to point out that the list of known organizations distinguishes between sub sections of organizations. For example, the two research IBM research laboratories, Almaden and Watson, have been included separately. The quality of sub sections might differ considerably and we respected the view of the authors. In most cases, the members of the sub sections deliberately chose to mention their sub section.
Lastly, we manually matched the 1247 unidentified records to the known list of countries. Overall, we noticed that the vast majority of authors from the USA did not include their country in the affiliation. At best, they included their state. Authors from others countries usually included their country. We have to point out that the country of the organization does not necessarily match the nationality of the author. For practical reasons it was impossible for use to determine the nationality of each CHI author and we believe that statistics on the organizational issue are of higher value than on the individual level. In summary, we have been able to match 93 percent of the records to a list of known organizations, and the remaining unmatched records are mainly from minor companies and institutes that occur only occasionally. All records with affiliation information were matched to a country.
Before continuing, we performed a quality check of the matching procedure. We randomly selected 800 of the 15600 records (5.1 percent) and manually checked whether the affiliation was matched correctly. We found 2 mismatches (0.25 percent), which gives us sufficient confidence in the quality of the matching to continue our analysis.
Citations
The bibliometric analysis is based on citations gathered from Google Scholar (GS). We developed software that automatically queried the website and stored the data back into our database. In the search query we included the title of the paper, its authors, and the year of publication. The process was conducted on August 22-23, 2008. Besides the citation count for every paper, we also collected the title of the publication from Google’s result page. We compared the title and the authors returned by GS with the original data in our database, to assess whether Google had found the correct paper. GS was not able to find 71 papers. These papers were excluded from the further analysis.
One of widely known measure for the similarity of two text strings is the Levenshtein distance (LD). The LD is defined as the number of operations necessary to transform one text string into another, where operations include insertion, deletion, or substitution of a single character. The average LD between all the titles of papers in our database and the resulting titles from GS was 2.79 (median=2). This number is still compromised by several factors. For one thing, the LD considers special characters such as spaces and punctuation marks, which can cause a considerable increase without being a meaningful difference. Moreover, GS does not return titles longer than about 100 characters. When we limit the calculation of LD to titles with no more than 100 characters, we receive a distance of 1.98. A mean of 1.98 can be considered an extremely good match between the title stored in the ACM database and GS because the LD is sensitive to the slightest difference in spaces, spelling, and punctuation marks.
Next, we calculated the relativity of the paper title in comparison to the returned title from GS. Given two text strings, the relativity normalizes the Levenshtein distance with respect to the lengths of the strings [29]. This calculation provides better results than the Levenshtein distance alone. The mean relativity for papers with title names shorter than 100 characters was 0.93. This result suggests sufficient quality in our queries to GS.
In addition, we randomly selected 100 papers, and checked the correctness of the GS result manually. From these 100 papers, GS recognized only three papers incorrectly. All three mismatches were due to the fact that authors had published multiple articles with exactly the same title in one year. This problem points towards a more general issue. Authors sometimes publish papers with exactly the same title at different venues, even within the CHI conference. Papers can appear as a full paper, but also as a late-breaking result. In the early days of the CHI conference, papers, in particular the results of panel discussions, were also republished as SIGCHI Bulletins. GS is not yet able to distinguish between these papers, and by default presents the paper with the highest citation count first.
We conclude that, although the citation counts from GS might not be perfect, there is no practical alternative and we believe that the quality of the citation counts is good enough to allow for valuable insights into the CHI proceedings. Before moving on to the results, we need to make a few definitions:
- Credit: One paper equals one credit. Each author receives an equal share of the credit. For example, for a paper written by four authors, each author receives 0.25 credits.
- Continents: The definition of continents is disputable, and a complete list of our mapping of countries to continents is available in the appendix.
- English speaking country: developed countries in which English is a traditional language, such as USA, UK, Ireland, Canada, Australia, New Zealand.
Results
The page limitation does not allow us to present the complete results. For example, we simply cannot show the complete list of the more than 700 organizations that have contributed to the CHI proceedings. The interested reader may consult the appendix to see the complete lists and rankings. We treated incomplete data, such as the 705 absent affiliations, as missing data in our analyses. We shall now present the results of our study by moving from the general proceedings, down to the countries, organizations, and papers.
Proceedings in general
The CHI conference has experienced strong growth during its 28 years of existence. The number of papers in the main proceedings has roughly doubled (see Figure 1), and the extended abstracts have outgrown the main proceedings in terms of numbers of authors, and also in terms of pages, since they were introduced in 1992 (see Figure 2). On average, for every paper in the main proceedings, we find 2.63 papers in the extended abstracts. For every page in the main proceedings we have 0.85 pages in the extended abstracts. However, if we focus on the last five years, we have a ratio of 1:1.2 pages. The number of authors in the main proceedings is on average half of the number of authors in the extended abstracts.
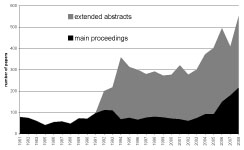
Figure 1 : papers per year in the main proceedings and in the extended abstracts (accumulated)
The length of the papers has also increased. For the period until 1993, a paper in the main proceedings had around five pages, which increased to around eight. The papers in the extended abstracts grew from about two pages in 2003 to an average of six pages in 2008. The papers in the extended abstracts today have reached the same length as the papers in the main proceedings before 1993. This effect can largely be explained by the page limitations given by the conference. Most authors write as many pages as allowed. However, one may speculate on whether this increase in length of the papers might be counterbalanced by an increased number of authors. In such a case, the overall productivity would have remained the same.
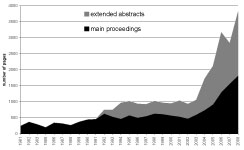
Figure 2 : pages per year in the main proceedings and in the extended abstracts (accumulated)
When we look at the ratio of articles per unique author and at the ratio of pages per unique author, we see that the there is no difference in the ratio of articles per author between the main proceedings and the extended abstracts, and that this ratio has remained fairly stable (see Figure 3). However, the ratio of pages per author for the extended abstracts is approaching the level of the main proceedings. This means that by now the unique authors in the extended abstracts write almost the same number of pages as unique authors in the main proceedings.
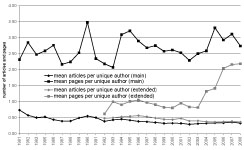
Figure 3: mean articles per unique author and mean pages per unique author across the main proceedings and the extended abstracts.
The bibliometric analysis shows that the papers in the main proceedings (mean = 40.167) are significantly (F(1,6295)=308.253,p<0.001) more cited than the papers in the extended abstracts (mean = 11.917).
Geography
Table 1 shows the sum of credits per continent and country. To provide a clear overview, we grouped the countries with fewer than five credits into the category “others”. More than 62% of the credits go to the USA, and the top four countries (USA, UK, Canada, and Japan) alone accumulate 82 percent of all credits. This means that the distribution of credits across countries goes even beyond Pareto’s 20/80 principle. 7.8 percent of the countries are already responsible for more than 82 percent of the credits. Moreover, 50 percent of the countries have fewer than 10 credits. It is also worthwhile mentioning that nearly 80 percent of all credits go to traditionally English speaking countries (USA, UK, Canada, Ireland, Australia, New Zealand).
| country | sum credits | main credits | extended credits | Cred./mill. pop. | h | g | |
|---|---|---|---|---|---|---|---|
| n. america | total | 4166.04 | 1576.78 | 2589.26 | - | - | - |
| usa | 3745.22 | 1387.03 | 2358.19 | 12.25 | 137 | 27 | |
| canada | 406.48 | 188.74 | 217.74 | 12.36 | 52 | 12 | |
| mexico | 12.33 | 1.00 | 11.33 | 0.12 | 2 | 2 | |
| other | 2.00 | 0.00 | 2.00 | - | - | - | |
| europe | total | 1392.95 | 386.95 | 1006.00 | - | - | - |
| uk | 508.95 | 182.46 | 326.48 | 8.38 | 52 | 12 | |
| germany | 177.18 | 39.74 | 137.44 | 2.15 | 19 | 7 | |
| sweden | 142.00 | 28.39 | 113.61 | 15.57 | 22 | 7 | |
| netherlands | 118.56 | 17.17 | 101.40 | 7.22 | 16 | 6 | |
| france | 82.66 | 27.03 | 55.63 | 1.34 | 19 | 6 | |
| finland | 79.55 | 30.59 | 48.96 | 15.07 | 16 | 5 | |
| denmark | 60.09 | 25.74 | 34.35 | 11.04 | 18 | 5 | |
| austria | 46.81 | 6.42 | 40.39 | 5.60 | 8 | 4 | |
| italy | 33.51 | 3.03 | 30.48 | 0.57 | 6 | 3 | |
| switzerland | 25.84 | 6.60 | 19.24 | 3.45 | 8 | 3 | |
| ireland | 19.85 | 7.85 | 12.00 | 4.62 | 6 | 2 | |
| belgium | 18.57 | 1.00 | 17.57 | 1.78 | 6 | 3 | |
| israel | 14.09 | 3.00 | 11.09 | 2.03 | 5 | 2 | |
| portugal | 10.67 | 0.00 | 10.67 | 1.00 | 3 | 2 | |
| russia | 10.00 | 0.00 | 10.00 | 0.07 | 4 | 2 | |
| spain | 9.34 | 0.33 | 9.00 | 0.21 | 3 | 1 | |
| norway | 9.08 | 2.83 | 6.25 | 1.93 | 3 | 2 | |
| greece | 7.00 | 3.00 | 4.00 | 0.63 | 4 | 2 | |
| poland | 6.33 | 0.00 | 6.33 | 0.17 | 1 | 1 | |
| other | 12.87 | 1.75 | 11.12 | - | - | - | |
| asia | total | 335.95 | 74.42 | 261.53 | - | - | - |
| japan | 260.48 | 57.66 | 202.82 | 2.04 | 35 | 9 | |
| south korea | 33.03 | 4.42 | 28.62 | 0.68 | 6 | 3 | |
| india | 12.48 | 0.85 | 11.63 | 0.01 | 2 | 1 | |
| singapore | 12.02 | 2.17 | 9.86 | 2.71 | 4 | 2 | |
| china | 7.08 | 5.33 | 1.75 | 0.01 | 3 | 2 | |
| other | 10.87 | 4.00 | 6.87 | - | - | - | |
| australia | total | 67.85 | 19.66 | 48.19 | - | - | - |
| australia | 49.38 | 11.83 | 37.55 | 2.38 | 9 | 4 | |
| new zealand | 18.48 | 7.83 | 10.64 | 4.42 | 9 | 3 | |
| s.america | total | 18.12 | 1.25 | 16.87 | - | - | - |
| brazil | 10.78 | 0.00 | 10.78 | 0.06 | 3 | 1 | |
| other | 7.33 | 1.25 | 6.08 | - | - | - | |
| africa | total | 13.61 | 0.73 | 12.88 | - | - | - |
| south africa | 12.75 | 0.00 | 12.75 | 0.26 | 5 | 2 | |
| Other | 0.86 | 0.73 | 0.13 | - | - | - |
Table 1 : credits, h‑index and g‑index per continent and country (sorted by continent and h‑index) [full table]
Canada shows a remarkable performance. It has roughly 20 percent fewer credits than the UK, in particular in the extended abstracts, but receives the same h/g-index as the UK. When we relate the total number of credits to the populations of the countries [taken from: 30], Canada even exceeds the USA and is only lower than Sweden and Finland.
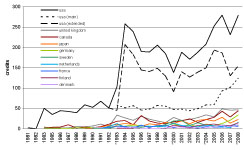
Figure 4 : credits per country over time. An * marks the years in which the conference took place in Europe.
When we look at the geographic development of the CHI proceedings over time, we notice a sharp increase in the contributions from the USA for the extended abstracts in the year 1993-1994 (see Figure 4). This may be explained by the introduction of the extended abstracts in the year 1992. While the USA contributions remained relatively stable over the years, the extended abstracts contributions of the USA dropped dramatically in the year 2000, which could be connected to the Internet Bubble crisis and the fact that the conference took place in the Netherlands. Many US companies usually publish in the extended abstracts (see Table 3), and we speculate that US companies might not have had the resources to send their employees overseas in that year.
Organizations
The majority of credits for the CHI proceedings go to universities (see Table 2). They received more than twice as many credits as companies, which receive more than twice as many credits as institutes. However, the proportion of credits in the main proceedings is similar to that in the extended abstracts. Universities, companies, and institutes receive approximately double the number of credits for the extended abstracts as for the main proceedings.
| total | main | extended | |
|---|---|---|---|
| university | 3681.57 | 1232.14 | 2449.42 |
| company | 1518.97 | 513.51 | 1005.46 |
| institute | 759.03 | 297.60 | 461.43 |
Table 2 : credits across types of organization
When we split up the organization types across the top twenty countries, we observe that on average 21 percent of the credits go to companies, 16 percent to institutes and 62 percent to universities (see Table 3). Notable deviations are visible for Canada, Denmark, and the UK. All of them have a stronger emphasis on Universities. 48 percent of Japan’s credits come from companies, which is the highest value of all countries.
| company | institute | university | ||||
|---|---|---|---|---|---|---|
| country | credit | percent | credit | percent | credit | percent |
| usa | 1120.2 | 0.30 | 486.9 | 0.13 | 2132.6 | 0.57 |
| uk | 62.5 | 0.13 | 0.3 | 0.00 | 420.6 | 0.87 |
| canada | 30.0 | 0.07 | 8.4 | 0.02 | 368.1 | 0.91 |
| japan | 123.9 | 0.48 | 19.5 | 0.08 | 115.4 | 0.45 |
| germany | 29.3 | 0.17 | 42.7 | 0.24 | 105.1 | 0.59 |
| sweden | 12.3 | 0.09 | 64.1 | 0.45 | 65.6 | 0.46 |
| netherlands | 15.3 | 0.13 | 25.1 | 0.21 | 78.2 | 0.66 |
| france | 16.9 | 0.20 | 51.5 | 0.62 | 14.2 | 0.17 |
| finland | 24.9 | 0.31 | 2.0 | 0.03 | 52.7 | 0.66 |
| denmark | 10.2 | 0.17 | 0.8 | 0.01 | 49.1 | 0.82 |
| australia | 10.0 | 0.20 | 8.1 | 0.16 | 31.3 | 0.63 |
| austria | 5.4 | 0.11 | 5.6 | 0.12 | 35.9 | 0.77 |
| italy | 6.9 | 0.21 | 10.9 | 0.33 | 15.7 | 0.47 |
| s. korea | 6.7 | 0.20 | 6.7 | 0.20 | 19.6 | 0.59 |
| switzerland | 2.2 | 0.08 | 1.5 | 0.06 | 22.1 | 0.86 |
| ireland | 3.5 | 0.18 | 8.0 | 0.40 | 8.4 | 0.42 |
| belgium | 5.7 | 0.30 | 0.0 | 0.00 | 12.9 | 0.70 |
| n. zealand | 0.5 | 0.03 | 0.0 | 0.00 | 18.0 | 0.97 |
| israel | 1.5 | 0.11 | 0.0 | 0.00 | 12.6 | 0.89 |
| india | 10.3 | 0.82 | 2.2 | 0.18 | 0.0 | 0.00 |
| Mexico | 3.8 | 0.31 | 0.0 | 0.00 | 8.5 | 0.69 |
Table 3 : credits across countries and organization types [full table]
The historic view provides a more detailed insight. While the contributions of the companies and institutes have remained fairly stable for the last 15 years, we see that the contributions from universities have more than quadrupled in the same period (see Figure 5). Notice that the data for this graph is slightly different from that for Figure 4. As mentioned in the data processing section above, we were able to match all authors that mentioned an affiliation with a country, but we were not able to match them all to an organization type. In particular the non-university and non-institute affiliations remain less well-matched.
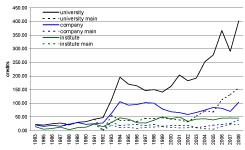
Figure 5 : credits over time by organization type
When we focus our attention on the individual organizations, we observe that 22 percent of the organizations are responsible for 80 percent of the credits. This proportion is very close to the Pareto Principle. Table 4 shows the top twenty organizations sorted by their h‑index. The Spearman rank correlation between the total number of credits, h‑index, and g‑index is r=0.986;n=758;p<0.001.
| organization | sum | main | ext. | h | g | nom. | awar. |
|---|---|---|---|---|---|---|---|
| palo alto res. ctr. | 130.88 | 76.56 | 54.32 | 57 | 9 | 1.90 | 0 |
| mit | 262.95 | 73.78 | 189.16 | 43 | 11 | 1.25 | 0 |
| carnegie mellon uni. | 298.51 | 126.09 | 172.42 | 41 | 11 | 8.53 | 2.00 |
| uni. toronto | 118.04 | 73.55 | 44.48 | 35 | 8 | 3.67 | 1.83 |
| georgia tech | 156.97 | 48.76 | 108.21 | 34 | 8 | 3.03 | 0 |
| microsoft | 153.75 | 86.91 | 66.83 | 34 | 8 | 6.33 | 1.42 |
| uni. calif. berkeley | 97.17 | 33.34 | 63.83 | 28 | 7 | 1.50 | 0 |
| uni. michigan | 120.33 | 43.04 | 77.29 | 27 | 7 | 0.48 | 0 |
| stanford uni. | 110.02 | 37.73 | 72.28 | 27 | 7 | 2.25 | 0 |
| uni. colorado boul. | 92.12 | 46.93 | 45.18 | 27 | 7 | 1.00 | 0 |
| ibm res. watson | 154.25 | 68.04 | 86.21 | 26 | 8 | 3.92 | 0 |
| uni. maryland | 88.98 | 30.71 | 58.27 | 25 | 6 | 1.70 | 0 |
| uni. calgary | 34.47 | 13.88 | 20.58 | 19 | 5 | 2.67 | 0 |
| xerox | 23.64 | 18.28 | 5.37 | 18 | 4 | 0 | 0 |
| uni. washington | 82.00 | 31.94 | 50.05 | 17 | 5 | 2.10 | 1.83 |
| ibm res. almaden | 36.31 | 16.92 | 19.39 | 16 | 4 | 3.92 | 0 |
| hewlett packard labs | 50.07 | 24.07 | 26.00 | 15 | 5 | 0 | 1.00 |
| virginia tech | 47.83 | 17.93 | 29.89 | 15 | 5 | 1.25 | 0 |
| apple computer | 42.06 | 18.92 | 23.14 | 15 | 5 | 0.25 | 0 |
| bellcore | 36.63 | 13.41 | 23.22 | 15 | 4 | 0 | 0 |
Table 4 : top twenty organizations in h-index order [full table]
The order of the organizations does not change significantly if they are sorted by the credits, the h‑index or the g‑index. We speculate that the fine differences between the h‑index and the g‑index might not matter at the level of organizations that have many publications. The organizations that publish many articles in the CHI proceedings are often also the organizations that are highly cited. The appendix includes a similar table that is limited to the last ten years, which represents current trends better.
A scatter plot showed a very steep decline in organizations with increasing credits. 83 percent of the organizations have fewer than 10 credits. A non-linear curve estimation analysis for Lotka’s Law revealed that the field-specific constant c should be 1612, resulting in the formula y=1612/x2 (R2=0.991). We also observe that most organizations in the top twenty are from the USA.
We shall now focus on the level of individual papers. We observe that the top 18 percent of papers are responsible for 80 percent of the citations, which is close to the Pareto Principle and Garfield’s observation [5]. A scatter plot revealed a steep decline in the frequency of papers with increasing citations. A non-linear curve estimation analysis for Lotka’s Law revealed that the field specific constant c should be 49500, resulting in the formula y=49500/x2 (R2=0.946).
Best Paper Award
Table 4 also includes columns that list the best paper awards and nominations. We notice that 62 percent of the nominations were given to the USA, followed by 12 percent to Canada and 9 percent to the UK. The papers published in 2008 are still too recent to have already received citations. We therefore compared the number of citations that the nominees (n=64), and award winners (n=12) from the years 2004-2007 have acquired against a random sample that was not nominated (normal) from the same years (n=76). An Analysis of Variance (ANOVA) was performed in which the status of the paper was the independent factor (normal, nominee, winner) and the number of citations was the dependent variable. There was no significant difference (F(1,149)=1.103, p=0.335) between the three groups of papers. In other words, the number of citations received by the random sample of not nominated papers did not differ significantly from that received by the nominated or award winning papers. Figure 6 shows that the high variance and the large number of outliers may be responsible for the non-significant results. There is a great deal of debate in the literature as to the definition of outliers and as to what to do with them. A thorough review of the various arguments is not possible here. Figure 6 shows that there are not only one or two outliers, but a considerable number of them. We argue that the exceptionally highly cited papers are an important part of the CHI conference and should not be removed. The data are more likely to be representative of the population as a whole if the outliers are included [31].
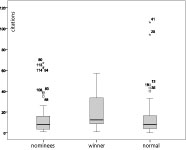
Figure 6 : Mean number of citations of the nominated, awarded, and normal papers (2004-2007).
One may wonder if the dominance of the USA in the CHI conferences may also have an impact on the nominations for the best paper award. When we compare the percentage of nominations to the percentage of credits, we notice that the USA is approximately evenly represented in the nominations and the credits (see Table 5). Canada, however, has only six percent of the credits, but achieves 12 percent of the nominations.
A Chi-Square test among the 16 countries that received either a nomination or an award revealed that there was no significant correlation between the percentage of credits and the percentage of combined awards and nominations (χ2=13.220;df=15;p=0.585). A second Chi-Square test revealed that there was also no significant correlation between the percentage of nominations and the percentage of awards (χ2=24.626;df=15;p=0.055).
| rank | country | nomin. | awards | total | % aw. & nom. | % cred. |
|---|---|---|---|---|---|---|
| 1 | USA | 52.91 | 13.58 | 66.49 | 0.604 | 0.625 |
| 2 | Canada | 12.53 | 3.08 | 15.62 | 0.142 | 0.068 |
| 3 | UK | 7.98 | 2.00 | 9.98 | 0.091 | 0.085 |
| 4 | Germany | 3.58 | 0.00 | 3.58 | 0.033 | 0.030 |
| 5 | Sweden | 4.17 | 0.00 | 4.17 | 0.038 | 0.024 |
| 6 | Finland | 1.00 | 0.00 | 1.00 | 0.009 | 0.013 |
| 7 | Japan | 1.00 | 0.00 | 1.00 | 0.009 | 0.043 |
| 8 | NewZealand | 1.83 | 0.00 | 1.83 | 0.017 | 0.003 |
| 9 | Israel | 0.50 | 0.00 | 0.50 | 0.005 | 0.002 |
| 10 | Italy | 0.50 | 0.00 | 0.50 | 0.005 | 0.006 |
| 11 | Denmark | 1.50 | 0.00 | 1.50 | 0.014 | 0.010 |
| 12 | France | 1.00 | 0.00 | 1.00 | 0.009 | 0.014 |
| 13 | Ireland | 1.00 | 0.00 | 1.00 | 0.009 | 0.003 |
| 14 | Angola | 0.00 | 0.33 | 0.33 | 0.003 | 0.000 |
| 15 | Austria | 1.00 | 0.00 | 1.00 | 0.009 | 0.008 |
| 16 | Switzerland | 0.50 | 0.00 | 0.50 | 0.005 | 0.004 |
Table 5 : Total number and percentage of nominations and credits.
Discussions and Conclusions
The CHI conference is one of the most important conferences for the HCI community. The results of this study show that the conference has grown rapidly in the last five years. The number of papers and authors has roughly doubled, while the number of pages has tripled. The increase in papers can be attributed, in particular, to universities. Their contributions have quadrupled in the last 15 years. When we focus on the organizations, we observe that the order in the ranking of the organizations does not change significantly if they are sorted by number of credits, h‑index, or g‑index. We speculate that the productivity of an organization is related to the quality of its papers. Organizations that publish many papers at the CHI conference also receive many citations. The raw sum of accepted papers is a blunt, but still effective, method of judging the success of researchers and their organizations [32].
Two other factors might have contributed to the rapid growth of the conference. Firstly, the introduction of the extended abstracts in 1992 had a massive effect on the proceedings, and by now their size in terms of papers and pages exceeds that of the main proceedings. The papers in the extended abstracts receive only about one quarter of the citations. Still, the extended abstracts have become an indispensable part of the conference, and we would like to encourage ACM and the conference organizers to include the extended abstracts in the calculation of the conference’s acceptance rate.
Secondly, the abandoning of the printed proceedings in favor of electronic proceedings on CD‑ROM and in the ACM digital library has practically eliminated constraints on the number of pages. It does not make any significant financial difference anymore whether the PDF files are four or eight pages long. Instead, the limiting factor is the available time of the reviewers who have to read all those pages. Their available time will naturally limit the size of papers, both for the extended abstracts and the main proceedings.
The main contributors to the conference are a relatively small group of organizations from the USA, Canada, and the UK. They have the largest number of credits and citations. Already 7.8 percent of the countries account for 80 percent of the credits. The USA, with 62 percent of the papers, is the largest contributor to the CHI proceedings. Given that the conference is organized by an American organization and that it had been a dedicated US conference since 1992, this might not be too surprising. Canada takes a special position, since it focuses on publishing highly cited papers in the main proceedings. It exceeds the much more populous USA with this strategy.
Canada has also received an over-proportionate number of nominations for the best paper award. We notice that no paper from the extended abstracts has received this award, and that the relationship between the number of credits, nominations, and awards is weak. Some countries receive more nominations than the distribution of credits would suggest, and other countries receive fewer. Authors from sixteen different countries have been nominated for the best paper award, but only authors from the USA, Canada, and the UK have received the actual award, with the exception of one unusual co-authorship from Angola.
Judging quality remains a difficult task for the initial reviewers, but also for the best paper award committee. Despite its honest efforts, the best paper award committee has not selected papers that are cited more often than other papers. In other words, the best paper award committee did not perform better than random chance. From this viewpoint, Desney Tan’s claim that “The Best of CHI awards represent the top one percent of research submissions to CHI” appears too optimistic [33].
Program committee members nominate papers for the best paper award and based on these nominations, the program chairs pick the winners. The program chairs are often acknowledged experts with senior status. What remains difficult for them might be even more difficult for the more junior members of the program committees. We may speculate whether the task of selecting papers that will be highly cited in the future is simply too difficult, if not impossible. In any case, we do have to ask ourselves what the purpose of the award is if it does not correlate with the views of the HCI community. We speculate if it might be worthwhile considering whether the conference attendees should be allowed to vote for the best paper.
The statistics presented in this study are certainly informative. We hope that the ranking of countries and organizations will help students and employees to make informed decisions when seeking education or employment within the CHI community. It may also help organizations to find effective partners in their specific region. But we do not want to conclude this paper without giving some practical recommendations to authors. We encountered several problems while systematically searching for articles in GS, and we would like to share our insights in order to guide authors towards higher bibliometric accuracy and thereby a better online visibility. The arrival of the Internet changed the landscape of scientific publication. More and more researchers rely on online search engines to find relevant literature. The online visibility of articles therefore becomes increasingly important, and the 2008 RAE demonstrates how important bibliometric analysis has become, even for the progress of scientific careers.
First of all, we would like to point out that the ranking order of GS results depends on the citation count. The more often an article has been cited, the higher it will appear in the results page. This ranking system is likely to strengthen the Mathews Effect, which states that highly cited papers will get even more citations, while rarely cited papers will remain rarely cited. It is therefore of utmost importance to gain at least a few citations for each publication, because many users of GS do not browse through more than one or two result pages before they adjust their search query. Being in the top-ten is key. The following practical tips might appear to many as obvious, but our experiences with the analysis of the CHI proceedings indicate that many others are still not aware of them. At the same time we would like to encourage Google to improve its algorithm by taking the problems listed below into account.
GS has problems with special characters, such as names with diacritics “ä, é, ç”, apostrophes “O'Reilly”, and ligatures “æ, fi, ß” [25]. We can fully support their observation, and would like to add that authors should use one consistent version of their name, ideally with all their initials. This increases the chances of a correct identification.
The same holds true for the titles of papers. We observed that GS has problems with extremely long titles, the umlaut, and typographic stylization such as superscript, subscript, italics, and bold. Punctuation marks can also be challenging. The em dash “—“ is certainly more aesthetically pleasing than an ordinary hyphen, but it causes trouble with bibliometric analyses. It is sad, but we have to recommend refraining from any stylistic ambitions in the titles of papers.
Needless to say, it is never a good idea to publish multiple articles with exactly the same name, even for an article that has matured from a workshop paper to a journal article. From the perspective of the h/g-index, it does not pay to publish the ideas of an article repeatedly. The citations will simply be split over several papers instead of focusing on one. To receive a high h/g-index, it is necessary to make every paper count. It is also advisable to choose a title that is specific. A paper entitled “Web Usability” will have to compete for attention with about 1700 papers. It might be worthwhile to first check the tentative title with GS to ensure that it is sufficiently infrequent.
Lastly, we would like to recommend that authors post their papers in their organizations’ repositories or on their own home pages. The ACM explicitly allows authors to “post author-prepared versions of the work covered by ACM copyright in a personal collection on their own Home Page and on a publicly accessible server of their employer” (ACM Copyright Policy, Version 4 Revised 11/01/02, Section 2.5 “Rights Retained by Authors and Original Copyright Holders”). It has been shown that such an Open Access strategy improves the impact of articles [34]. The combination of authors publishing their articles in open repositories and the power of GS in indexing them may hopefully lead to an efficient and effective Open Access library. Since not every organization has the financial resources to access the ACM Digital Library, this is therefore not only a good strategy for increasing online visibility but also an active means for lessening the gap between the developing and the developed world.
Acknowledgements
We thank Bernard Rous and Ronald Boisvert of the ACM, who made the metadata of the CHI proceedings available to us. Razvan Cristescu and Matthias Rauterberg contributed to this study with their valued feedback.
Appendix
The full lists and rankings are available at: http://www.bartneck.de/projects/research/chi2009/
References
- Greenberg, S., & Buxton, B. (2008). Usability evaluation considered harmful (some of the time). Proceedings of the Twenty-sixth annual SIGCHI conference on Human factors in computing systems, Florence, Italy, pp 111-120. | DOI: 10.1145/1357054.1357074
- Barkhuus, L., & Rode, J. (2007). From Mice to Men–24 Years of Evaluation in CHI. Twenty-fith annual SIGCHI conference on Human factors in computing systems - Alt. CHI.
- Wulff, W., & Mahling, D. E. (1990). An assessment of HCI: issues and implications. SIGCHI Bulletin, 22(1), 80-87. | DOI: 10.1145/101288.101305
- Newman, W. (1994). A preliminary analysis of the products of HCI research, using pro forma abstracts. Proceedings of the SIGCHI conference on Human factors in computing systems: celebrating interdependence, Boston, Massachusetts, United States, pp 278 - 284. | DOI: 10.1145/191666.191766
- Garfield, E. (2006). The History and Meaning of the Journal Impact Factor. Journal of the American Medical Association, 295(1), 90-93. | DOI: 10.1001/jama.295.1.90 | DOWNLOAD
- Lotka, A. J. (1926). The frequency distribution of scientific productivity. Journal of the Washington Academy of Sciences, 16(12), 317-323.
- Bartneck, C. (2008). What Is Good? - A Comparison Between The Quality Criteria Used In Design And Science. Proceedings of the Conference on Human Factors in Computing Systems (CHI2008), Florence, pp 2485-2492. | DOI: 10.1145/1358628.1358705
- Bartneck, C., & Rauterberg, M. (2007). HCI Reality - An Unreal Tournament. International Journal of Human Computer Studies, 65(8), 737-743. | DOI: 10.1016/j.ijhcs.2007.03.003
- Jefferson, T., Wager, E., & Davidoff, F. (2002). Measuring the Quality of Editorial Peer Review. Journal of the American Medical Association, 287(21), 2786-2790. | DOI: 10.1001/jama.287.21.2786
- Lawrence, P. A. (2003). The politics of publication. Nature, 422(6929), 259-261. | DOI: 10.1038/422259a | DOWNLOAD
- Horrobin, D. F. (1990). The philosophical basis of peer review and the suppression of innovation. Journal of the American Medical Association, 263(10), 1438-1441. | DOI: 10.1001/jama.263.10.1438
- Enserink, M. (2001). SCIENTIFIC PUBLISHING: Peer Review and Quality: A Dubious Connection? Science, 293(5538), 2187a-2188. | DOI: 10.1126/science.293.5538.2187a
- Peters, D. P., & Ceci, S. J. (1982). Peer-review practices of psychological journals: The fate of published articles, submitted again. Behavioral and Brain Sciences, 5(2), 187-195.
- Holden, G., Rosenberg, G., & Barker, K. (2005). Bibliometrics in social work. Binghamton: Haworth Social Work Practice Press.
- Moed, H. F. (2005). Citation analysis in research evaluation. Dordrecht: Springer.
- Garfield, E. (1979). Is citation analysis a legitimate evaluation tool? Scientometrics, 1(4), 359-375. | DOI: 10.1007/BF02019306
- MacRoberts, M., & MacRoberts, B. (1996). Problems of citation analysis. Scientometrics, 36(3), 435-444. | DOI: 10.1007/BF02129604
- Lawrence, P. A. (2008). Lost in publication: how measurement harms science. Ethics in Science and Environmental Politics, 8(1), 9-11. | DOI: 10.3354/esep00079
- Universities UK. (2007). The use of bibliometrics to measure research quality in UK higher education institutions: Universities UK. | DOWNLOAD
- Katz, J., & Hicks, D. (1997). Desktop scientometrics. Scientometrics, 38(1), 141-153. | DOI: 10.1007/BF02461128
- Pauly, D., & Stergiou, K. I. (2005). Equivalence of results from two citation analyses: Thomson ISI’s Citation Index and Google’s Scholar service. Ethics in Science and Environmental Politics, 2005, 33-35.
- Jacso, P. (2005). As we may search–comparison of major features of the Web of Science, Scopus, and Google Scholar citation-based and citation-enhanced databases. Current Science, 89(9), 1537-1547.
- Jacso, P. (2006). Dubious hit counts and cuckoo's eggs. Online Information Review, 30(2), 188-193.
- Jacso, P. (2006). Deflated, inflated and phantom citation counts. Online Information Review, 30(3), 297-309.
- Harzing, A. W. K., & van der Wal, R. (2008). Google Scholar as a new source for citation analysis. Ethics In Science And Environmental Politics, 8, 61-73. | DOI: 10.3354/esep00076
- Meho, L. I., & Yang, K. (2007). Impact of data sources on citation counts and rankings of LIS faculty: Web of science versus scopus and google scholar. Journal of the American Society for Information Science and Technology, 58(13), 2105-2125. | DOI: 10.1002/asi.20677
- Hirsch, J. E. (2005). An index to quantify an individual's scientific research output. Proceedings of the National Academy of Sciences of the United States of America, 102(46), 16569-16572. | DOI: 10.1073/pnas.0507655102
- Egghe, L. (2006). Theory and practise of the g-index. Scientometrics, 69(1), 131-152. | DOI: 10.1007/s11192-006-0144-7
- Marzal, A., & Vidal, E. (1993). Computation of normalized edit distance and applications. IEEE Transactions on Pattern Analysis and Machine Intelligence, 15(9), 926-932. | DOI: 10.1109/34.232078
- United Nations Department of Economic and Social Affairs. (2006). World Population Prospects. New York.
- Orr, J. M., Sackett, P. R., & Dubois, C. L. Z. (1991). Outlier Detection And Treatment In I/O Psychology: A Survey Of Researcher Beliefs And An Empirical Illustration. Personnel Psychology, 44(3), 473-486. | DOI: 10.1111/j.1744-6570.1991.tb02401.x
- Green, R. G. (2005). The Paradox of Faculty Publications in Professional Journals. In G. Holden, G. Rosenberg & K. Barker (Eds.), Bibliometrics in Social Work (Vol. 41, pp. 103-108). Philadelphia: Haworth Press.
- Gold, V. (2008, April 3rd). SIGCHI Announces Best of CHI 2008 Award Winners: Conference Honors Research that Addresses Problems of Accessibility, Homelessness, Healthcare, Emerging Markets. ACM Press Release. | DOWNLOAD
- Lawrence, S. (2001). Free online availability substantially increases a paper's impact. Nature, 411(6837), 521-521. | DOI: 10.1038/35079151
© ACM, 2009. This is the author's version of the work. It is posted here by permission of ACM for your personal use. Not for redistribution. The definitive version was published in Proceedings of the Conference on Human Factors in Computing Systems (CHI2009), Boston, pp.699-708 (2009) | DOI: 10.1145/1518701.1518810 | last updated April 6, 2009 | All Publications