DOI: 10.1007/s11192-010-0242-4 | CITEULIKE: 7223649 | REFERENCE: BibTex, Endnote, RefMan | PDF ![]()
Bartneck, C., & Jun, H. (2010). The Fruits of Collaboration in a Multidisciplinary Field. Scientometrics, 85(1), 41-52.
The Fruits of Collaboration in a Multidisciplinary Field
Department of Industrial Design
Eindhoven University of Technology
Den Dolech 2, 5600MB Eindhoven, NL
christoph@bartneck.de,j.hu@tue.nl
Abstract - Collaboration between researchers and between research organizations is generally considered a desirable course of action, in particular by some funding bodies. However, collaboration within a multidisciplinary community, such as the Computer-Human Interaction (CHI) community, can be challenging. We performed a bibliometric analysis of the CHI conference proceedings to determine if papers that have authors from different organization or countries receive more citations than papers that are authored by members of the same organization. There was no significant difference between these three groups, indicating that there is no advantage for collaboration in terms of citation frequency. Furthermore, we tested if papers written by authors from different organizations or countries receive more best paper awards or at least award nominations. Papers from only one organization received significantly fewer nominations than collaborative papers.
Keywords: bibliometrics ⋅ citations ⋅ collaboration ⋅ organizations
Introduction
The human endeavor to understand and improve the world is fractured into disciplines, including the natural sciences, social sciences, engineering and design. A great effort is being made to bridge the gaps between the disciplines [10, 21] because, as Charles Percy Snow [20] argued “The clashing point of two subjects, two disciplines, two cultures - of two galaxies, so far as that goes-ought to produce creative chances. In the history of mental activity that has been where some of the break-throughs came.”
Many scientists, engineers and designers share this positive vision of the benefits of collaboration. Beaver [5] lists eighteen reasons why scientists collaborate. It may be for the purpose of accessing expertise, equipment, recourses or funding. People might hope for higher prestige, more efficiency & effectiveness, or the ability to tackle bigger problems. Scientists may also want to increase their social network or share the excitement in a certain topic. Many collaborations are based on the principle of tutoring. Senior staff may collaborate with junior staff to help them with their work and vice versa. experienced
These are all good reasons for collaboration, but takes effort to communicate across organizations, cultures and disciplines. International negotiation, for example, has been studied in great detail in an attempt to minimize the failure of communication [11]. Moreover, different disciplines operate under different paradigms [4]. Scientists, for example, have an emphasis on understanding the world, engineers focus on technology and designers tend to operate intuitively. The friction between disciplines becomes apparent when a multidisciplinary community is confronted with the task to judge the quality of its members’ contributions, such as the diverse submissions to a conference [2].
But not only do some scientists, some engineers and some designers believe that collaboration has a positive effect on the quality of results and the productivity, also some some policy-makers believe it [14]. Whole research institutes and funding streams are motivated under the assumption that synergy leads to more and better results. The Seventh Framework Programme (FP7) of the European Union is an example of a major funding stream that requires international collaboration from its applicants. Such international collaboration in the sciences can be particularly useful for less developed countries [9] and it may result in publications with higher citation rates than purely domestic papers [8]. Lee and Bozeman [14], on the other hand, indicated that collaboration does not necessarily lead to productivity improvements. Moreover, He [23] pointed out that international collaboration does not have greater epistemic authority compared to domestic or even local collaboration. At times, the best experts in the field may sit just down the corridor.
These studies usually focus on the classical disciplines and it is unclear what effect research collaboration has within an inherently multidisciplinary field. The human computer interaction (HCI) field is a prominent example of a multidisciplinary field. It features several organizations (e.g. SIGCHI), journals and conferences. The Conference on Human Factors in Computing Systems (CHI) is arguably one of the biggest and most important conference in the field of HCI. The conference has experienced nearly exponential growth in the last 15 years [3]. Designers, engineers and social scientists contribute to its success and challenges of multidisciplinary collaboration have surfaced in the past [1]. The proceedings of the CHI conference are therefore an appropriate data source to investigate the effects of collaboration.
We focus on the question whether collaboration improves the quality of published articles. We can distinguish three types of collaboration. Authors from the same organization might work together (local collaboration), authors from different organizations within the same country may team up (domestic collaboration) and authors from different organizations in different countries may join forces (international collaboration). We distinguished between sub sections of organizations. For example, the two IBM research laboratories, Almaden and Watson, have been included separately, because the quality of these sub sections might differ considerably. In most cases, members of sub sections deliberately chose to mention their sub sections.
We did not judge if collaboration partners were from different disciplines. Being a member of a computer science department does not automatically mean that you are a computer scientist. It would be extremely difficult to evaluate the biography of the many authors that contributed to the CHI conference. This study therefore focuses on the three collaboration types mentioned above. The conclusions we can draw for true multidisciplinary collaboration is therefore limited, but we can evaluate if the results from collaboration on a more general level is of interest to the multidisciplinary field of HCI.
The quality of the papers is the prime reason to raise interest of a community and CHI papers have already been through the double blind peer review process. Several attempts have been made to evaluate the quality of the review process, but one conceptual problem remains. For a complete analysis it is necessary to also consider rejected papers. This information is usually not available, and hence we are not able to compare the success of accepted papers with the success of rejected papers. Previous studies used deception to test the review process by resubmitting rejected papers [17], but given the ethical issues associated with the use of deception, we did not use their method. Instead, we focus our attention on the best paper award. It allows us to analyze nominees, winners, and non winners. The program committee members of the conference can nominate papers and the program chairs make a selection amongst the nominations. They attempt to select “excellent” papers and probably take the results of the review process into account. Since 2004, the nominees and award winners are indicated in the conference brochure, and hence we focus on the years 2004-2008. Henry et al. have already visually explored the CHI conference [12]. Their study has an emphasis on individual researchers and their collaboration networks. They provide a bibliometric study that includes a co-authorship analysis, but it does not take the citations of the publications into account.
The Research Assessment Exercise (RAE) is the official procedure under which the performance of researchers and their organizations in the United Kingdom is being evaluated. The use of bibliometric indicators for the RAE is being debated for some time now [19]. In 2008, the ACM started to include citation counts for the papers in their digital library. Despite the increasing popularity of bibliometric indicators, several disadvantages have of their usage have been brought forward. MacRoberts & MacRoberts [15], reviewed objections to the usage of these indicators. An obvious objections is, for example, the fact that not every citation is intended to positively acknowledge previous work. At times, researchers also criticize other pieces of work. Lawrence [13] argued that the usage of bibliometric indicators has a systematic influence on the behavior of individual researchers. It would change their focus from making groundbreaking discoveries to publishing their papers in high impact factor journals.
The question if and to what degree bibliometric indicators should be used in the RAE continues. The UK government would like to use them in an effort to reduce the costs of the procedure, which amounted to 12 million in 2008 [7]. The representative body for the executive heads of UK universities (UUK) considers bibliometric indicators in 2007 as “ probably the most useful of a number of variables that could feasibly be used to create a metric of some aspect of research performance” [22]. The RAE will be replaced by the Research Excellence Framework (REF) and Graeme Rosenberg, Hefce’s REF project manager, explained [6] that “We just don’t think bibliometrics are sufficiently mature at this stage to be used in a formulaic way or, indeed, to replace expert review. However, there is still scope for bibliometrics to inform the assessment process.” While the debate continues, improvements to the methodology of bibliometric indicators are being developed. In summary we are interested in the effect of collaboration on the quality of the resulting papers. More specifically, we are interested in the following research questions:
- What is the overall nature of collaboration in a multidisciplinary conference such as CHI?
- Do papers with local/domestic/international authors receive different numbers of best papers awards or nominations?
- Do papers with local/domestic/international authors receive different numbers of citations?
2 Method
We performed a bibliometric analysis of the CHI proceedings to be able to investigate the research questions. We will now discuss the data analysis process. The data processing is similar to to the one used in our previous study [3]. We therefore include only a short summary here.
We used Google Scholar (GS) as the source of our analysis, since it offers the widest coverage of scientific literature in comparison to ISI’s Web of Science (WOS) or Elsevier’s Scopus [16]. Moreover, GS is the only index that includes all sections of the CHI proceedings for all years. We received the meta data of the CHI proceedings from the ACM in an XML format. We processed the XML and mapped the records to a list of organizations. We manually checked 5.1 percent of our records on the correctness of the mapping and were satisfied with the 0.25 error rate. We automatically queried GS on August 22-23, 2008 to receive the citations for each paper. We performed an automatic and a manual check on the results of the queries and the results were satisfying.
We conclude that the citations counts from GS are not perfect, but the low error rate leads us to believe that this method is good enough for the given purpose of acquiring valuable insights into the proceedings of the CHI. Please refer to Bartneck & Hu [3] for a detailed description of the data processing and testing. Before moving on to the results, we need to define how authors and their organizations were credited for their papers. Each author receives one credit for every paper he/she (co)authored. For example, for a paper written by four authors, each author receives one credit.
3 Results
Figure 1 focuses on the collaboration between the continents. The red numbers indicate the number of credits that each continent gathered and the numbers on the lines indicated how much shared credit the continents have through collaboration. Europe, for example, has a total of 1506 credits, of which 31 are shared with Asia, 10 with Australia, 345 with North America, 4 with South America and 3 with Africa. This means that there are 345 papers that were authored by the combination of at least one European author and at least one American author. For this graph we used a subset of the 5697 papers. We also excluded the papers of which none of the authors’ affiliations was matched with our list of known organizations.
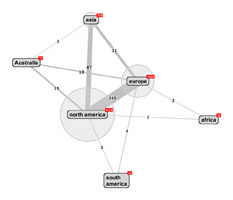
Fig. 1 Network graph of the continents contributing to the CHI conference.
Next, we explored the collaboration between the countries (see Figure 2 ). The USA has clearly most credits, followed by the UK and Canada. A detailed ranking of the countries and their organizations is available [3]. When we focus on the collaboration, we observe that the USA, UK and Canada collaborate with each other more than any other country.
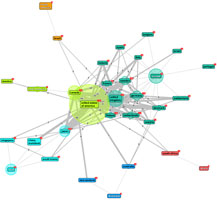
Fig. 2 Network graph of the countries contributing to the CHI conference.
We have to take into consideration that the older papers in our set had more time to collect citations than the newer ones. The collaboration between researchers might have increased over time, in particular since the arrival of the internet. The newer, possibly more collaborative papers might have had less opportunity to collect citations and therefore our analyses could be biased. We plotted the average number of organizations over the years (see figure 3 ). The years 1982, 1982 and 1992 are not plotted, since their data was missing. We observe no dramatic increase in the number of organizations over time.
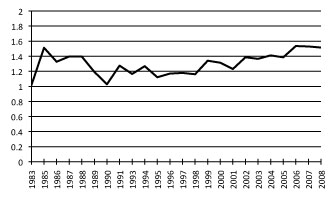
Fig. 3 Average number of organizations per paper over time.
We noticed that the standard deviation was rather high (see Table 1 ). We conducted a linear regression analysis and although we found a significant relation between the years and the number of organizations (p < .001) the resulting R2 was extremely low (0.017). So the correlation between years and number of organizations can be ignored.
| Year | Average | Std.Dev. | Nr.Papers |
|---|---|---|---|
| 1983 | 1.02 | 0.50 | 60 |
| 1985 | 1.51 | 1.23 | 41 |
| 1986 | 1.33 | 0.96 | 55 |
| 1987 | 1.40 | 0.95 | 58 |
| 1988 | 1.40 | 0.96 | 48 |
| 1989 | 1.19 | 0.72 | 73 |
| 1990 | 1.03 | 0.48 | 71 |
| 1991 | 1.28 | 0.83 | 98 |
| 1993 | 1.17 | 0.72 | 218 |
| 1994 | 1.27 | 0.84 | 358 |
| 1995 | 1.12 | 0.61 | 313 |
| 1996 | 1.17 | 0.76 | 300 |
| 1997 | 1.18 | 0.74 | 280 |
| 1998 | 1.16 | 0.78 | 292 |
| 1999 | 1.34 | 0.88 | 273 |
| 2000 | 1.31 | 0.81 | 277 |
| 2001 | 1.23 | 0.65 | 321 |
| 2002 | 1.39 | 0.91 | 277 |
| 2003 | 1.37 | 0.87 | 301 |
| 2004 | 1.41 | 0.91 | 372 |
| 2005 | 1.39 | 0.77 | 402 |
| 2006 | 1.54 | 0.98 | 495 |
| 2007 | 1.53 | 0.79 | 408 |
| 2008 | 1.52 | 0.93 | 553 |
Table 1 Mean and standard deviation of number of organizations per year.
The number of organizations had a significant but small correlation with citations (Pearson Correlation= -0.045,p < 0.001). The number of countries also had significant but small correlation with the citations (Pearson Correlation= -0.033,p = 0.006). The number of authors had no significant correlation with citations (Pearson Correlation= 0.008,p = 0.275).
We performed a multiple linear regression analysis on the 5697 papers in which the number of organizations, the number of countries and the number of authors were the independent variables and the citations the dependent variable. Table 2 presents the frequency, mean citation and standard deviation of the citations. The R2 value for the model of 0.003 shows that the significant correlations mentioned above have no practical importance. The extremely low Beta Coefficients support this view. When citations was predicted it was found that number of authors (B = 0.0034,p = 0.022), number of organizations (B = -0.053,p = 0.003) were significant predictors. The number of countries was not a significant predictor (B = -0.011,p = 0.497). We have to consider that the underlying assumptions concerning the normal distribution of the citations is probably violated. The significance tests should therefore be considered as indicators and not as definite proof.
| Number | N | Mean citations | Std.Dev. | |
|---|---|---|---|---|
| Number of organizations | 1 | 4073 | 24.12 | 69.06 |
| 2 | 1179 | 21.97 | 45.20 | |
| 3 | 278 | 15.37 | 35.49 | |
| 4 | 102 | 8.11 | 19.07 | |
| 5 | 44 | 18.75 | 97.24 | |
| 6 | 15 | 2.60 | 3.56 | |
| 7 | 4 | 0.50 | 1.00 | |
| 8 | 2 | 3.00 | 4.24 | |
| Number of countries | 1 | 4942 | 23.65 | 65.26 |
| 2 | 638 | 17.62 | 41.36 | |
| 3 | 88 | 21.65 | 76.74 | |
| 4 | 24 | 3.17 | 7.08 | |
| 5 | 4 | 0.50 | 0.58 | |
| Number of authors | 1 | 1089 | 21.05 | 71.46 |
| 2 | 1739 | 23.24 | 67.84 | |
| 3 | 1260 | 25.05 | 64.80 | |
| 4 | 792 | 21.85 | 44.48 | |
| 5 | 421 | 21.23 | 48.48 | |
| 6 | 192 | 19.20 | 44.92 | |
| 7 | 86 | 16.97 | 36.55 | |
| 8 | 60 | 24.32 | 87.79 | |
| 9 | 22 | 45.64 | 93.40 | |
| 10 | 14 | 34.93 | 38.36 | |
| 11 | 11 | 41.18 | 60.90 | |
| 12 | 4 | 59.50 | 111.72 | |
| 13 | 4 | 14.75 | 23.07 | |
| 14 | 2 | 60.50 | 84.15 |
Table 2 Frequency, mean citation and standard deviation per number of organizations, number of countries and number of authors.
When we categorize papers across the number of countries and the number of organizations involved, we observe that the vast majority of papers are from one organization that naturally resides in one country (see Table 3 ). This means that most papers are from authors of the same organization. Notice that at some values seem implausible at the first sight. For example, there are 70 credits with one organization, but two countries. The reason for this oddity is that sometimes we were not able to identify the organization, but we were able to identify the country. This means that the number of organizations should be considered as the number of known organizations. The mismatch between the number of identified affiliations and countries explains this odd phenomenon. Since we were able to identify 93 percent of the organizations, we feel confident that Table 3 still holds valuable information.
| nr. countries | ||||||
|---|---|---|---|---|---|---|
| nr. organizations | 1 | 2 | 3 | 4 | 5 | Total |
| 1 | 4001 | 70 | 2 | 0 | 0 | 4073 |
| 2 | 769 | 396 | 13 | 1 | 0 | 1179 |
| 3 | 116 | 113 | 44 | 4 | 1 | 278 |
| 4 | 39 | 36 | 15 | 12 | 0 | 102 |
| 5 | 14 | 15 | 8 | 5 | 2 | 44 |
| 6 | 2 | 7 | 5 | 1 | 0 | 15 |
| 7 | 1 | 0 | 1 | 1 | 1 | 4 |
| 8 | 0 | 1 | 0 | 0 | 0 | 1 |
| Total | 4942 | 638 | 88 | 24 | 4 | 5696 |
Table 3 Papers across number of organization and number of countries.
The extremely high standard deviations visible in Table 2 triggered us to look at the distribution of the citations. We notice that that they are very unevenly distributed. Figure 4 shows that high citation counts are only achieved by a very small number of papers. 23% of the papers have no citations at all, 50% have four or fewer citations and 80% have 26 or fewer citations. The ”Skewness of Science” is a well known phenomenon [18].
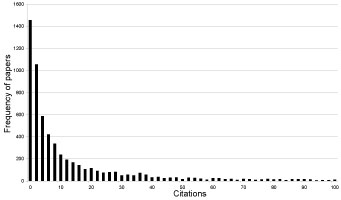
Fig. 4 Frequency of papers by citations (the tail continues at a very low paper frequency.)
We performed an analysis of variance (ANOVA) on the 5696 papers in which the type of collaboration (local, domestic, international) was the independent variable and the citations the dependent variable. The describtive statistics are available in table 4 . The type of collaboration had a significant effect on citations (F(2, 5696) = 3.305,p = 0.037).
| Collaboration type | N | Mean citations | Std.Dev. | Std.Error |
|---|---|---|---|---|
| local | 4073 | 24.12 | 69.06 | 1.08 |
| domestic | 941 | 20.75 | 42.11 | 1.37 |
| international | 683 | 18.07 | 47.82 | 1.83 |
Table 4 N, Mean and Std.Dev. and Std. Error of citations per collaboration type
Post-hoc t-tests with Bonferroni corrected alpha revealed that the citations for international papers (m=18.07) were almost significantly (p=0.061) lower than the citations for local papers (m=24.12). Figure 5 shows the boxplot for the citations in all three conditions. It visualizes the large variance in citations across the conditions.
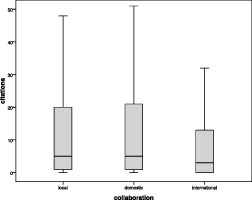
Fig. 5 Boxplot of citations across the collaboration conditions.
A Chi-Square test revealed that there is a significant correlation (χ2 = 28.695; df = 4; p < 0.001) between collaboration and award. Table 5 shows the counted and expected number between collaboration and award. International and domestic papers receive more nominations than expected.
| Collaboration | |||||
| award | count | local | domestic | international | total |
| normal | Count | 4020.0 | 909.0 | 660.0 | 5589 |
| Expected Count | 3995.8 | 923.2 | 670.1 | 5589 | |
| nomination | Count | 42.0 | 28.0 | 20.0 | 90 |
| Expected Count | 64.3 | 14.9 | 10.8 | 90 | |
| winner | Count | 11.0 | 4.0 | 3.0 | 18 |
| Expected Count | 12.9 | 3.0 | 2.2 | 18 | |
| total | Count | 4073 | 941 | 683 | 5697 |
| Expected Count | 4073 | 941 | 683 | 5697 | |
Table 5 Count and expected count of award and collaboration
4 Discussion and Conclusions
The study has some limitations. We have been able to distinguish between the number of authors, organizations and countries, but this does not necessarily indicate multidisciplinary collaboration. It might be possible, for example, that authors from two different design departments collaborated. Moreover, membership of a certain faculty does not automatically indicate the expertise of an author. Designers might work for a design department as well as for a computer science department. Some authors might even have multiple backgrounds or have a different nationality than their hosting organization. For practical reasons, we were not able to reveal the competence and nationality of each author. This study cannot make strong claims about true multidisciplinary collaboration. However, we are able to analyze collaboration on a more abstract level, namely, if collaboration within a multidisciplinary field has benefits. The collaboration between authors from different organizations and countries might still help to create outstanding results that are interesting for a multidisciplinary field.
North America and Europe collaborate most within the CHI conference. More specifically, the USA, UK and Canada co-author many papers, which is not too surprising given their shared language and culture. More generally we observe that although the number of organizations and the number of countries did have an overall significant correlation with the citations, their effect size is so small that it does not have any practical importance. Our results therefore support related studies [9, 14], but since our data is based on an inherently multidisciplinary community, we believe that our results expand their initial results. We can also observe that most papers at CHI are from one to three authors that are spread across one to two organizations that are located in one country. Table 3 clearly shows that the majority of papers come from single organizations. There is no substantial difference in citations within this group.
Overall, we cannot observe a general beneficial effect of collaboration of any type (local, domestic or international) on the quality of the papers, measured by their citation counts. Other factors must play an important role, since our analysis shows that the citations are very unevenly distributed across the papers. A small number of papers receive a high citation count while half of the papers do not have more than four citations yet. This results supports Seglen’s observation that science its skewed” [18]. This leads to the enormous standard deviations that are visible in Table 2 and Figure 5 . An obvious factor could be the competence of the authors. An interesting future direction to study could be whether the citation counts of the individual authors influence the citation count for their co-authored papers. More specifically, it would be interesting to see if the citation counts for papers that have been written by authors with low individual citation counts improve through the collaboration. It might also be interesting to study the reverse effect. Does the citation count for collaborative papers of highly cited authors increase or decrease through the collaboration?
Although we could not find a strong positive effect of collaboration on citations, it did increase the number of best paper award nominations. Papers with international or domestic collaborations seem to receive substantially more nominations than papers with only local collaborations. We do not have a clear answer of why this is and can only offer our speculations. The program committees at the CHI conference are highly international and from many different organizations. It might be easier for the committee members to nominate papers that reflect the structure of the committee. But we cannot offer any hard proof for this speculation. The precise structure of the committees over the years is not available to us.
We do not intend to discourage collaboration, since it may have positive effects that go beyond what a bibliometric analysis can measure. It may foster international networks and may help to build trust amongst different cultures. These motivations to collaborate might be stronger in the CHI community in comparison to the natural sciences, in which authors often have to collaborate to be able to afford expensive research infrastructure. Infrastructure necessary for a study in the area in CHI can be afforded by most individual organizations. We speculate that much of the collaboration within CHI might be due to shared interests, which is certainly a good motivation to work together. Still, our analysis shows that the collaboration in itself does not necessarily result in higher citations. Policy makers should realize that collaboration in itself does not yield good results in all research communities at all times. Collaboration comes with a price. Communication and coordination require extra effort that does not automatically result in increased productivity [14] or citation counts. Collaboration should therefore not be overemphasized, in particular when it comes to the allocation of research funding or on the progression of individual careers.
Acknowledgements
We thank Bernard Rous and Ronald Boisvert of the ACM, who made the metadata of the CHI proceedings available to us.
References
- Jonathan Arnowitz and Elizabeth Dykstra-Erickson. Chi and the practitioner dilemma. Interactions, 12(4):5–9, 2005.
- Christoph Bartneck. What is good? - a comparison between the quality criteria used in design and science. In Conference on Human Factors in Computing Systems (CHI2008), pages 2485–2492, Florence, 2008. ACM.
- Christoph Bartneck and Jun Hu. Scientometric analysis of the chi proceedings. In Conference on Human Factors in Computing Systems (CHI2009), pages 699–708, Boston, 2009. ACM.
- Christoph Bartneck and M. Rauterberg. Hci reality - an unreal tournament. International Journal of Human Computer Studies, 65(8):737–743, 2007.
- Donald Beaver. Reflections on scientific collaboration (and its study): Past, present, and future. Scientometrics, 52(3):365–377, 2001.
- Zo Corbyn. Hefce backs off citations in favour of peer review in ref, 18 June 2009 2009.
- Natasha Gilbert. Quality of uk research assessed, 18 December 2008 2008.
- Wolfgang Glänzel. National characteristics in international scientific co-authorship relations. Scientometrics, 51(1):69–115, 2001.
- Wolfgang Glänzel, A. Schubert, and H. Czerwon. A bibliometric analysis of international scientific cooperation of the european union (19851995). Scientometrics, 45(2):185–202, 1999.
- Stephen Jay Gould. The hedgehog, the fox, and the magister’s pox : mending the gap between science and the humanities. Harmony Books, New York, 1st edition, 2003.
- J.L. Graham. Brazilian, japanese and american buisness negotiations. Journal of international business studies, 14(1):47–62, 1983.
- Nathalie Henry, Howard Goodell, Niklas Elmqvist, and Jean-Daniel Fekete. 20 years of four hci conferences: A visual exploration. International Journal of Human-Computer Interaction, 23(3):239 – 285, 2007.
- P. A. Lawrence. Lost in publication: how measurement harms science. Ethics in Science and Environmental Politics, 8(1):9–11, 2008.
- Sooho Lee and Barry Bozeman. The impact of research collaboration on scientific productivity. Social studies of science, 35(5):673–702, 2005.
- M. MacRoberts and Barbara MacRoberts. Problems of citation analysis. Scientometrics, 36(3):435–444, 1996.
- Lokman I. Meho and Kiduk Yang. Impact of data sources on citation counts and rankings of lis faculty: Web of science versus scopus and google scholar. Journal of the American Society for Information Science and Technology, 58(13):2105–2125, 2007.
- D. P. Peters and S. J. Ceci. Peer-review practices of psychological journals: The fate of published articles, submitted again. Behavioral and Brain Sciences, 5(2):187–195, 1982.
- Per O. Seglen. The skewness of science. Journal of the American Society for Information Science, 43(9):628–638, 1992. 10.1002/(SICI)1097-4571(199210)43:9¡628::AID-ASI5¿3.0.CO;2-0.
- Bernard W. Silverman. Comment: Bibliometrics in the context of the uk research assessment exercise. Statistical Science, 24(1):15–16, 2009.
- C. P. Snow. The two cultures: and a second look. University Press, Cambridge,, [2d edition, 1964.
- Stephen Edelston Toulmin. Return to reason. Harvard University Press, Cambridge, Mass., 2001.
- Universities UK. The use of bibliometrics to measure research quality in UK higher education institutions. Universities UK, 2007.
- He Zi-Lin. International collaboration does not have greater epistemic authority. Journal of the American Society for Information Science and Technology, 60(10):2151–2164, 2009. 10.1002/asi.21150.
This is a pre-print version | last updated August 13, 2010 | All Publications