DOI: 10.1007/s11192-010-0306-5 | CITEULIKE: 8331943 | REFERENCE: BibTex, Endnote, RefMan | PDF ![]()
Bartneck, C., & Kokkelmans, S. (2011). Detecting h-index manipulation through self-citation analysis. Scientometrics, 87(1), 85-98.
Detecting h-index manipulation through self-citation analysis
Department of Industrial Design
Eindhoven University of Technology
Den Dolech 2, 5600MB Eindhoven, NL
christoph@bartneck.de, s.kokkelmans@tue.nl
Abstract - The h-index has received an enormous attention for being an indicator that measures the quality of researchers and organizations. We investigate to what degree authors can inflate their h-index through strategic self-citations with the help of a simulation. We extended Burrell's publication model with a procedure for placing self-citations, following three different strategies: random self-citation, recent self-citations and h-manipulating self-citations. The results show that authors can considerably inflate their h-index through self-citations. We propose the q-index as an indicator for how strategically an author has placed self-citations, and which serves as a tool to detect possible manipulation of the h-index. The results also show that the best strategy for an high h-index is publishing papers that are highly cited by others. The productivity has also a positive effect on the h-index.
Keywords: h-index, self-citation, manipulation, q-index, simulation
1 Introduction
In the competitive academic world, it is necessary to assess the quality of researchers, and their organizations. The allocation of resources and individual careers depend on it. In the UK, for example, the use of bibliometric indicators for the national Research Assessment Exercise (RAE) has long been discussed [17]. Efforts have been made to make such assessments as objective as possible. While the productivity could relatively easy be measured by counting publications, assessing the impact of research often relied on the count of citations received. In 2005, Hirsch proposed the h-index, which tries to bring productivity and impact into a balance [9].
It is hard to underestimate the effect that his proposal had on the field of scientometrics. Google Scholar lists 1130 citations for his original paper as of June 16th, 2010. Some authors even divide the research field into a pre and post Hirsch period [14]. A wealth of extensions, modifications have since been proposed [13, 12] and also new indicators have been developed, such as the g-index [4]. These modification and new indicators are intended to improve the original h-index. The arrival of the Publish and Perish software made the calculation of these diverse indicators accessible to a more general public.
An elaborated review on the benefits and problems of the h-index is available [5]. We will focus on the problem of self-citations, which has polarized the research community. On the one hand, self-citations can be considered a natural part of scientific communication, while others condemn it as a means to artificially inflate bibliometric indicators. Besides this fundamental divide about the role an importance of self-citations, there are also practical issues. Reliably filtering self-citations is currently only practical in highly consistent data sets, such as from the Web of Science. But even Thomson-Reuter had to introduce the ResearcherID to indentify unique researchers, in particular if researchers have the same name. The Web of Science might be a useful data set for traditional disciplines, such as Physics, but its coverage is insufficient for research fields in which conference proceedings play an important role [11]. Google Scholar (GS) offers the widest coverage of academic communication, but filtering self-citations from its results is currently not reliably possible. And maybe we even should not filter them, since they form an organic part of the citation process [8] and self-citations make up for up to 36% of all citations [1]. This might make it difficult to sharpen the h-index by excluding self-citation as it was already proposed [15]. It has also been demonstrated that results from GS can potentially be manipulated through mock publication [10].
Still it would be useful to be able to distinguish between authors that cite their previous work to clarify the relationship with the paper at hand and authors that strategically cite their papers even if they are not directly relevant to the current paper.
One method of strategically manipulating the h-index is the following: first cite the paper(s) that have currently as many citations as the h-index and then proceed downwards from there. Lets look an example to illustrate this strategy. Figure 1 shows the citation profile for an example author that published 60 papers. His papers are sorted by the citations they have received. He currently has an h-index of 20, which is visualized by the diagonal line. This means that he has at least 20 papers that have each been cited at least 20 times. We will refer to the paper that has the least citations and still contributes to the h-index as the h-paper. In this case it is paper number 20. If he would cite the h-paper and paper number 21, that each have currently 20 citations, then his h-index would increase to 21. He would have 21 papers that each have at least 21 citations. With only investing two self-citations, this author could inflate his h-index by one. A more subtle strategy would be to only cite papers that currently have fewer citations than the author’s h-paper since citing already highly cited papers is unlikely to increase the h-index quickly.
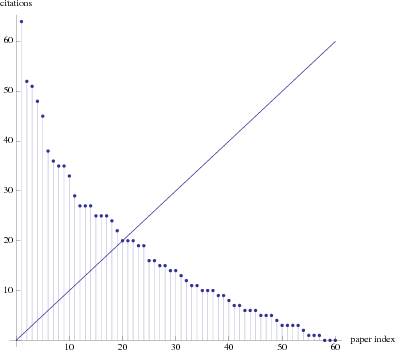
Fig. 1 Citation profile of an example author.
Given that up to 36% of all citations are self-citations, the potential inflation of bibliometric indicators could be enormous. We therefore focus on the following research questions:
- How much can authors inflate their h-index through strategic self-citations?
- How can we detect strategic self-citation?
- What influence has the authors’ productivity, quality, career length, and proportion of self-citations on the authors’ h-index?
2 Method
To be able to investigate how far the h-index can be inflated we need to consider extreme authors that focus all their self-citations on increasing their h-indexes. We are currently not aware of a sufficient number of such extreme authors to be able to appropriately answer all our research questions with data from real authors. The only exception might be Ike Antkare, an mock scientist who is only citing himself [10] We therefore did no base our analyses on existing authors, but focused on simulated authors.
Wolfgang Glänzel and his co-authors proposed a stochastic model for the publishing and citation process [6, 7]. However, here we make use of a more recent stochastic model proposed by Burrell [2], which is better suited for our simulation. The main result of this model as described in equation 1 defines is the expected number of papers that receive at least n citations by time T:

|
(1) |
with B(x; a,b) the regularized incomplete beta function defined as
|
(2) |
and Γ(a) the gamma function. The model depends on quality parameters which characterize a certain author:
- T is the time passed since the start of the researchers career
- θ is the productivity (mean number of publications per unit time)
- ν is the standard shape parameter of the citation distribution (gamma distribution), which is related to its hight.
- 1∕α is the standard scale parameter of the citation distribution (gamma distribution), which is related to its width.
 is the mean citation rate (average number of citations per paper per year)
 - n is the number of citations
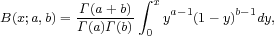
Equation 1 can be considered as the average citedness of papers from authors of a given quality (see Figure 2 ). The graph has the expected shape for citation indexes and appears to match reality. It follows the well documented skew [16] and hence we assume face validity of the model. We invert the expression in equation 1 to create a theoretical citation profile for an example author characterized by these quality parameters.
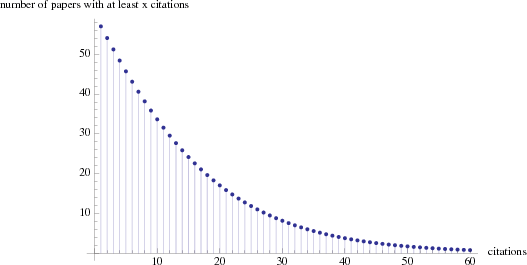
Fig. 2 Average citedness of papers from authors of productivity θ = 3, career length T = 20, mean citation rate  =
=  with ν = 3 and α = 2
We used Burrell’s model to simulate the publication process of an average author defined through the parameters mentioned above. We added one parameter μ, which is defined as the number of self-citations per paper. For practical reasons, we defined μ as a constant, but it is conceivable that the number of self-citations might change over the duration of a scientist’s career. We implemented three different self-citation strategies:
- the author makes μ strategic self citations by the method described above (unfair condition)
- the author cites his μ last papers (fair condition)
- the author randomly cites μ of papers (random condition)
The fair condition is based on the observation that the number of self-citations is the highest for new papers and declines rapidly over time [1]. The random condition provides us with a baseline against which we can compare the other two conditions. The simulation, implemented in Mathematica, consists of a main loop that cycles for the p published papers from 1 to θ × T through the following steps:
- calculate the current hp-index of the author
- calculate the citations received from other researchers through Burrell’s model
- place μ self citations through one of the three strategies described above
- calculate indicators, such as the q-index described below, for the current state
- sum the citations from others and the self-citations
3 Results
To answer the question how much an authors can inflate their h-index through self-citations we first would like to present an archetypical author. He publishes three papers per year over a total of 20 years and he makes three self-citations per paper. Figure 3 shows how the h-index develops over the period of publishing each of the sixty papers. After 20 years the author would have an h-index of 19 if he had used the unfair strategy, while a random self-citation strategy would have resulted in an h-index of only 14. Through the strategic placement of his self-citations, he was able to inflate his h-index by 5.
Fig. 3 Development of hp-index over published papers p for an author with θ = 3, career length T = 20, mean citation rate  =
=  with ν = 3 and α = 2
If we now look at the citation index of the unfair author, we notice a humpback around the h-paper, which is in this case the 19th paper (see Figure 4 ). An author with a random self-citation strategy does not have such a humpback. This may come at no surprise, since the humpback is a direct result of self-citing papers close to the h-paper.
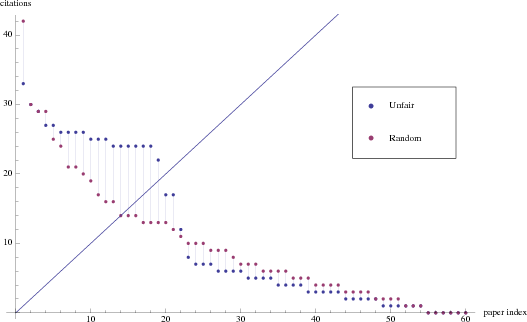
Fig. 4 Citation profile c60,i over paper index i of an author in the unfair and in the random condition with θ = 3, career length T = 20, mean citation rate  =
=  with ν = 3 and α = 2, and for a total number of published papers of p = θ × T = 60
To be able to assess the size of the humpback we propose the q-index. Quasimodo, a fictional character in Victor Hugo’s novel “The Hunchback of Notre Dame”, inspired its name. Quasimodo has a severely hunched back, which reminded us of the humpback in the citation profile. In comparison to the penalty system proposed by Burrell [3] the q-index does not decrease the citation count, but it introduces a stand alone indicator for the self-citaiton behavior.
The q-index can be calculated as follows. First, sort all papers (i = 1…p) of
an author or organization, given a certain number of already published papers p, according to their citations in a descending order: cp,i. This creates the well
known citation profiles, as shown in Figure 1
. This citation profile is characterized
by h-index hp. For each self-citation of a paper that has equal or fewer citations
than the hp-paper, the author receives a q-score. This q-score is calculated by
dividing 1 by the number of different citations scores between the hp-paper and the
paper that receives the self-citation. If the author cites the hp-paper(s) then the
score will be  . If he cites paper(s) that have the next fewer citations, then he
receives a score of
. If he cites paper(s) that have the next fewer citations, then he
receives a score of  and so forth. Next papers i which have the same citation score cp,i as the previous one, receive the same q-score. The formal definition is given
by:
and so forth. Next papers i which have the same citation score cp,i as the previous one, receive the same q-score. The formal definition is given
by:
|
(3) |
with ap,i given by
|
(4) |
Note that we only take into account the q-scores for the actually cited papers i, and therefore the summed q-score that an author receives for publishing a new paper p can only range between 0 and μ.
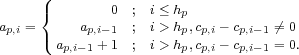
Lets take an example to illustrate the q-scores. Figure 5 shows the citation profile of our archetypical unfair author. The x-axis lists the q-scores that this author receives for citing his own papers. Notice that the author does not receive any q-score for self-citing papers that have more citations than the hp-paper. These papers are on the left of the diagonal h-line. Citing these papers does not directly inflate the h-index and are therefore not considered when calculating q-scores. Also notice that papers that have the same number of citations also receive the same q-scores. Their order can be assumed to be random and hence it would not be fair to give them different q-scores.
Fig. 5 Unfair citation profile of Figure 4 with the q-scores on the x-axis.
We plotted the q-scores in the order in which the papers were published (see Figure 6 ). If the author publishes a new paper that cites three of his own papers, then the three q-scores he received are summed. The paper index on the x-axis thereby defines the order in which the papers were published. Initially, all three self-citing strategies produce the same q-scores. This comes at no surprise since the fourth published paper can only cite its three predecessors. Only starting from the fifth paper, the author can choose which paper not to cite. A few papers later, we find significant differences between the three self-citation conditions. The unfair author receives high q-scores with very little spread, since he is always citing very close to the hp-paper.
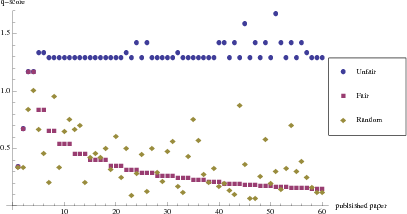
Fig. 6 Summed q-score indexes over published paper p, for the unfair, fair and random condition.
The author with a fair self-citing strategy receives lower and lower q-scores (see Figure 6). This can be explained by the fact that the total number of publications grows much faster than the h-index. The proportion of papers that have fewer citations than the hp-paper (to the right of the hp-paper) to the papers that have equal or more citations than the hp-paper (from the hp-paper to the left) is increasing (see Figure 7 ). The new papers that the fair author cites become further and further away from the hp-paper and hence attract lower and lower q-scores.
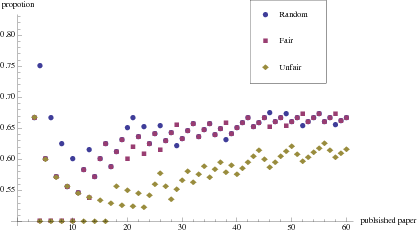
Fig. 7 Proportion of papers with fewer citations than the h-paper.
An author with a random self-citation strategy has a much higher spread in his q-scores, but they also appear to decrease. The growing number of papers that have fewer citations than the hp-paper can also explain this trend. The papers in this long tail cause lower and lower q-scores (see Figure 7 ).
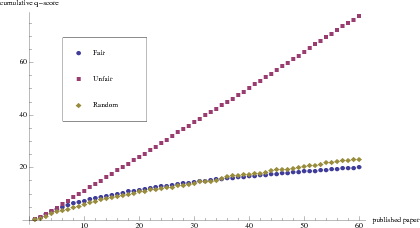
Fig. 8 Unnormalized q-index p×Qp over published papers p, for the unfair, fair and random condition.
We propose the q-index as the summed q-scores the author received for each self-citation s ranging from 0 to the total number of self-citations μ, in published paper j, to a paper in the citation profile indexed by ij,s. This is normalized by the number of published papers p:
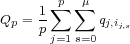
|
(5) |
The normalization by p assures that the q-index is approximately constant over all published papers if an author consistently cites according to the unfair scheme. This linear behavior can be seen from the unnormalized q-index in Figure 8 for the unfair condition, while in the fair and the random condition it flattens out and are in general far below the unnormalized q-index of the unfair condition (see Figure 8 ). Interestingly, the curve for the fair and the random condition are very close to each other. It might be difficult to distinguish between authors that use these two strategies. The q-index’s range follows as:

|
(6) |
The q-index should be accompanied by the standard deviation of the summed q-scores. For our example of our archetypical author, the q-indexes at p = 60 are available in Table 1 . The q-index of the fair and random condition are within one standard deviation from each other. We may therefore conclude that the q-index is not able to detect a significant differences between these two conditions. The q-index for the unfair condition is approximately ten standard deviations away from the q-index of the random condition and approximately four standard deviations away from the fair condition. It would be very unlikely if the difference observed would be due to chance. To test this hypothesis, we performed the non-parametric Mann-Whitney test, since we cannot assume a normal distribution of the data. The distributions in the random and unfair conditions differed significantly (Mann-Whitney U = 41.5,n1 = n2 = 60,P < 0.01, two-tailed).
Table 1 q-index and standard deviation across all conditions
| condition | Q | std.dev. |
| Random | 0.475 | 0.076 |
| Fair | 0.509 | 0.149 |
| Unfair | 1.176 | 0.179 |
Next, we were interested in how the different parameters of Burrell’s model influence the
development of the h-index. We started by varying the productivity θ from one
paper per year to eighteen papers per year. These values seem plausible minimum
and maximum values. Of course, an director of a research institute that insists
on co-authorship of every paper produced in his/her institute may exceed these
boundary conditions, but the analysis of honorary authorship are not in the focus of
our study. The other parameters remained at their stereotypical setting of career
length T = 20, mean citation rate  =
=  with ν = 3 and α = 2. Figure 9
shows
that h-index quickly increases 0 < θ < 5 and then slowly flattens. An author that
publishes six papers per year will have an more than double the h-index compare to an
author that publishes only one paper per year. The unfair strategy benefits in
particular by an increased productivity, since more published papers also mean more
self-citations.
with ν = 3 and α = 2. Figure 9
shows
that h-index quickly increases 0 < θ < 5 and then slowly flattens. An author that
publishes six papers per year will have an more than double the h-index compare to an
author that publishes only one paper per year. The unfair strategy benefits in
particular by an increased productivity, since more published papers also mean more
self-citations.
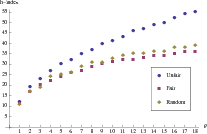 (a) h-index across the productivity θ
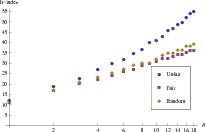 (b) Same as (a) but on a logaritmith productivity scale
Fig. 9 (a) h-index across the productivity θ. (b) Same, but on a logaritmith productivity scale. On this scale, the fair and random citation strategies confirm the straight lines as also observed by Burrell. The unfair strategy, however, clearly deviates from the linear behavior.
The next parameter we varied is the career length T between one and forty years, which
again seemed plausible boundary conditions. The remaining parameters were set to the
stereotypical values of θ = 3, mean citation rate  =
=  with ν = 3 and α = 2. Figure 10
shows a linear increase for the h-index for all three conditions. The h-score increases by
approximately one per year.
with ν = 3 and α = 2. Figure 10
shows a linear increase for the h-index for all three conditions. The h-score increases by
approximately one per year.
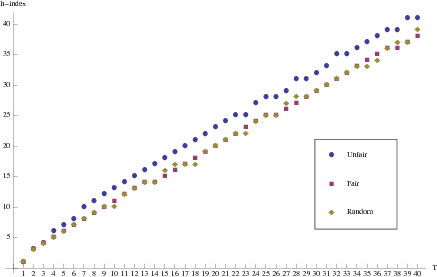
Fig. 10 h-index across the career length T.
We varied the number of self-citations per papers μ from one to ten, which appeared to be reasonable limits. The other parameters remained at their stereotypical settings. The results displayed in Figure 11 show that μ has a smaller effect on the h-index compared to θ and T. In the fair and random condition, the increasing μ results on only a mild increase in the h-index. In the unfair condition, the h-index grows over μ, but again less compared to θ and T. The small effect size is also visible in absolute terms. With ten self-citations per paper, an unfair author is only able to get up to an h-index of around 30, while he can get up to 50 with a publication rate of 18 papers per year.
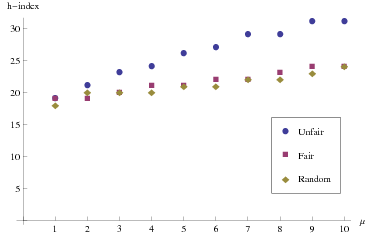
Fig. 11 h-index across the number of self citation μ.
Next, we changed the shape parameter ν and the scale parameter α of the citation
distribution, keeping in mind that  is the mean citation rate, which defines how many
citations a paper receives from other researchers. We increased the value for ν and α from
one to ten, which appeared reasonable boundary conditions. The other parameters remained
at their stereotypical settings. Figure 13
shows that the increasing value for ν increases the number of citations from others, which in turn negates the advantage
of strategic self-citations. At ν, there is no more difference between the unfair
condition and the other two conditions. For authors that produce highly esteemed
works by others, strategic self-citations have little positive effect. Burrell offered a
similar result in his Figure 4(a), although he kept α at 5 and increased ν from 5 to
500.
is the mean citation rate, which defines how many
citations a paper receives from other researchers. We increased the value for ν and α from
one to ten, which appeared reasonable boundary conditions. The other parameters remained
at their stereotypical settings. Figure 13
shows that the increasing value for ν increases the number of citations from others, which in turn negates the advantage
of strategic self-citations. At ν, there is no more difference between the unfair
condition and the other two conditions. For authors that produce highly esteemed
works by others, strategic self-citations have little positive effect. Burrell offered a
similar result in his Figure 4(a), although he kept α at 5 and increased ν from 5 to
500.
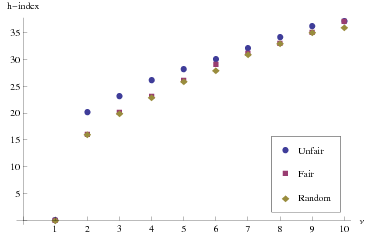
Fig. 12 h-index across the height of the citation distribution parameter ν.
When increasing the value for α, the mean citations rate drops, which has the opposite effect from increasing ν. And indeed, Figure 12 shows that the h-index decreases over an increasing value for α. The gap between the unfair condition and the other two conditions increases, indicating that making strategic self-citations becomes increasingly beneficial.
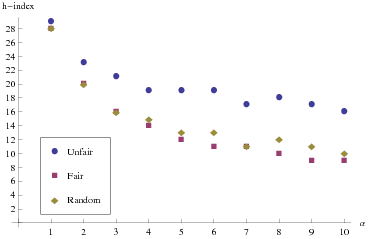
Fig. 13 h-index and q-scores across the width of the citation distribution parameter α.
To assess how strong the effect of productivity, career length, number of self-citations, and mean citation rate, is on the h-index, we calculated the average change in the h-index as:
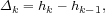
|
(7) |
where hk is the the h-index when the parameter (θ,T,μ,ν,α) is k, ranging from 2 to the maximum of the respective parameter. The average Δk and its standard deviation is displayed in Table 2 . The mean citation rate has the strongest impact on the h-index. The increase of ν by one increases the h-index on average by four and an increase in α of one decreases the h-index by around two. The second strongest effect stems from the productivity of the author. By publishing one paper more per year, the author’s h-index increases by approximately 1.5. With every year passed, the h-index increases on average by one. The number of self-citations has only a strong effect for authors that strategically place them. For all other authors, it has the smallest benefit.
| parameter | condition | meanΔ | std.dev.Δ |
| θ | unfair | 2.53 | 1.50 |
| fair | 1.47 | 1.42 | |
| random | 1.65 | 1.69 | |
| T | unfair | 1.03 | 0.58 |
| fair | 0.95 | 0.32 | |
| random | 0.97 | 0.67 | |
| μ | unfair | 1.33 | 0.87 |
| fair | 0.56 | 0.53 | |
| random | 0.44 | 0.53 | |
| ν | unfair | 4.11 | 5.99 |
| fair | 4.11 | 4.51 | |
| random | 4.00 | 4.58 | |
| α | unfair | -1.44 | 2.01 |
| fair | -2.11 | 2.52 | |
| random | -2.00 | 2.65 | |
Table 2 The average Δ and standard deviation for all parameters.
The results of our simulation show that authors can significantly inflate their h-index, and possible also other indices, by strategically citing their own publications. Calculating the q-index helps identifying such behavior and plotting the individual q-scores over the sequence of published papers allows us to gain additional insights into the publication history of an author. The q-index also allows us to run standard statistical test for cases that are ambiguous. The unfair author in our study is an extreme example and real authors might apply more subtle strategies to manipulate their h-index. The q-index also conveniently ranges from 1 to μ, which gives it an easy to interpret range. Our simulation is able to provide the benchmark of a random self-citation behavior, which can be used to compare the real authors’ q-index against.
Overall we can conclude that the unfair self-citation strategy is mainly useful for authors that are less productive and that attract less citations from others. The most effective method to increase one’s h-index is to produce work that is highly cited by other. The next best strategy is to be productive. The length of the career only has a moderate influence. On average, authors can increase their h-index by one per year, as it was predicted by Hirsch [9].
This study does have some limitations. We have to acknowledge that our simulations has not yet been verified by comparing its results to data from real authors. However, we hope to test the q-index on real authors in the next phase of our project.
The application of the q-index to real data may proof to be difficult, since it requires knowledge of each publication, including the date of each received citations. While this is relatively easy to accomplish in a simulation, the data from the real world has a tendency to be incomplete and occasionally ambiguous. A first application could be achieved on the well structured data from the Web of Science and in a second phase, attempts could be made to parse the results from Google Scholar.
We also have to consider that the mean citation rate does not model the size of the research community in which a certain author may operate. This potentially influential factor is not part of Burrell’s model and hence we are unable to make any judgements about it. We are also not able to make any judgements about the differences between scientific disciplines.
In essence, we showed that the h-index is vulnerable to manipulations by self-citations. We propose the q-index as a metric to judge how strategic the self-citations of an author have been. In addition, we showed that the best way to increase one’s h-index is to write interesting papers. This might be no surprise, but sometimes it is necessary to even state the obvious.
References
- Dag Aksnes. A macro study of self-citation. Scientometrics, 56(2):235–246, 2003.
- Quentin L. Burrell. Hirsch’s h-index: A stochastic model. Journal of Informetrics, 1(1):16–25, 2007.
- Quentin L. Burrell. Should the h-index be discounted? ISSI Newsletter, 3-S:65–67, 2007.
- Leo Egghe. Theory and practise of the g-index. Scientometrics, 69(1):131–152, 2006. 10.1007/s11192-006-0144-7.
- Miguel Garcia-Perez. A multidimensional extension to hirschs h-index. Scientometrics, 81(3):779–785, 2009.
- W. Glänzel and A. Schubert. Predictive aspects of a stochastic model for citation processes. Information Processing and Management, 31(1):69–80, 1995.
- Wolfgang Glänzel and U. Schoepflin. A stochastic model for the ageing of scientific literature. Scientometrics, 30(1):49–64, 1994.
- Wolfgang Glänzel, Bart Thijs, and Balazs Schlemmer. A bibliometric approach to the role of author self-citations in scientific communication. Scientometrics, 59(1):63–77, 2004.
- J. E. Hirsch. An index to quantify an individual’s scientific research output. Proceedings of the National Academy of Sciences of the United States of America, 102(46):16569–16572, 2005.
- C. Labbe. Ike antkare one of the great stars in the scientific firmament. ISSI Newsletter, 6(2):48–52, 2010.
- Lokman I. Meho and Kiduk Yang. Impact of data sources on citation counts and rankings of lis faculty: Web of science versus scopus and google scholar. Journal of the American Society for Information Science and Technology, 58(13):2105–2125, 2007. 10.1002/asi.20677.
- Richard Van Noorden. Metrics: A profusion of measures. Nature, 465:864–866, 2010.
- John Panaretos and Chrisovaladis Malesios. Assessing scientific research performance and impact with single indices. Scientometrics, 81(3):635–670, 2009.
- Gangan Prathap. Is there a place for a mock h-index? Scientometrics, 84(1):153–165, 2010.
- Michael Schreiber. Self-citation corrections for the hirsch index. Europhysics Letters, 78(3):0002, 2007.
- Per O. Seglen. The skewness of science. Journal of the American Society for Information Science, 43(9):628–638, 1992.
- Bernard W. Silverman. Comment: Bibliometrics in the context of the uk research assessment exercise. Statistical Science, 24(1):15–16, 2009.
This is a pre-print version | last updated March 15, 2011 | All Publications