DOI: 10.1007/s11192-010-0281-x | CITEULIKE: 7872028 | REFERENCE: BibTex, Endnote, RefMan | PDF ![]()
Bartneck, C. (2011). The End Of The Beginning - A Reflection On The First Five Years Of The HRI Conference. Scientometrics, 86(2), 487-504.
The End Of The Beginning - A Reflection On The First Five Years Of The HRI Conference
Department of Industrial Design
Eindhoven University of Technology
Den Dolech 2, 5600MB Eindhoven, NL
christoph@bartneck.de
Abstract - This study presents a historical overview of the International Conference on Human Robot Interaction (HRI). It summarizes its growth, internationalization and collaboration. Rankings for countries, organizations and authors are provided. Furthermore, an analysis of the military funding for HRI papers is performed. Approximately 20% of the papers are funded by the US Military. The proportion of papers from the US is around 65% and the dominant role of the US is only challenged by the strong position of Japan, in particular by the contributions by ATR.
Keywords: HRI, conference, military, bibliometrics
Introduction
The International Conference on Human Robot Interaction (HRI) has established itself as a premium conference. Volunteers worked very hard during the last five years to organize this annual event at which the latest research at the intersection between robots and humans is presented. The conference was not without competition. Already at its start, the IEEE International Symposium on Robot and Human Interactive Communication (Ro-Man) offered a publication venue for over 15 years. The ACM Conference on Human Factors in Computing Systems (CHI) has and still is accepting papers on human-robot interaction. So far, the HRI community managed to sustain the conference. After five years of operation, it appears wise to reflect on the start-up years so that we can guide its further maturation. Otherwise we will start taking certain policies for granted although the original conditions under which they had been brought to life have changed. At the same time we need to bring certain underlying conflicts within the community to the surface so that they do not start eating us up from the inside. Discussing them in the open helps to maintain a healthy relationship between the groups of people with different viewpoints.
One of the most controversial issues is the degree to which HRI research is associated to the military and what social responsibility researchers must accept. Several heated debates took place and I will come back to this issue at the end of this paper. Other “fields of tension” include the balance between engineering topics and psychological topics, the apparent dominance of US research, and the review process. Bibliometric analyses has previously been successfully used to understand fields of tensions and some of the characteristics of the underlying research community. The HRI conference can be considered to be a spin out of the CHI conference and there is still a strong connection between the two. Authors that publish at the HRI conference also often publish at the CHI conference. Several studies analyzed the proceedings of the CHI conference. Barkhuus and Rode pointed out that the proportion of papers that include an evaluation increased over time [2]. This result might have inspired Greenberg and Buxton to express their concerns about an over-reliance on formal evaluation methods [11]. Can the same trend be observed at the HRI conference? What is the proportion of technical papers that include an evaluation?
An informal look at the proceedings of the HRI conference quickly reveals that the majority of papers comes from the US. A similar trend has been observed for the CHI conference [4]. But how strong exactly is this dominance and how does it related to the organizational structure of the conference? Does the diversity the authors’ nationality increase when the conference is not hosted in the US? The HRI conference is still young and is currently building its identity. Repeated authorship might help building such an identity [14] and hence the proportion of returning authors to the conference is of interest. Henry et. al. [12] discovered that there was no correlation between the acceptance rate at a given year and the citations that the papers of that year received. How did the acceptance rate of the HRI conference develop and how did the citations develop over time?
The aim of this paper is to base the ongoing discussions on facts rather than opinions. The facts have been gathered through a bibliometric analysis of the HRI proceedings. Of course it will be necessary to offer some interpretations of the facts, but I will try to clearly separate facts from my personal opinions.
Method
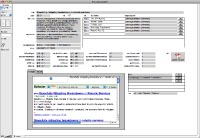
The meta data of the HRI proceedings has been harvested from the ACM Digital Library and entered into a Filemaker database (see figure 1 ). The title, year, abstract, keywords, and DOI were copied from the website of the ACM DL into the Filemaker database. The remaining meta data was manually entered based on the available information. For example, the five papers that received the best paper award were identified and then marked in the database. Filemaker features a Web Viewer, which allowed me to display the results of a Google Scholar (GS) query with the title of paper directly within Filemaker. It was possible to directly check the correctness of the results by comparing the results from GS with the complete set of meta data in the database. I then copied the number of citations into the database. The same method was used to display the results of an ACM DL query based on the DOI of the paper.
The key concept of the Filemaker database is the many-to-many relationship between authors and organizations and between sponsors and papers. One author may be a member of multiple organizations and one organization may have multiple authors. Along the same lines, one paper might be supported by many sponsors and one sponsor might support multiple papers. Figure 2 shows the entity relationship diagram of the Filemaker database.
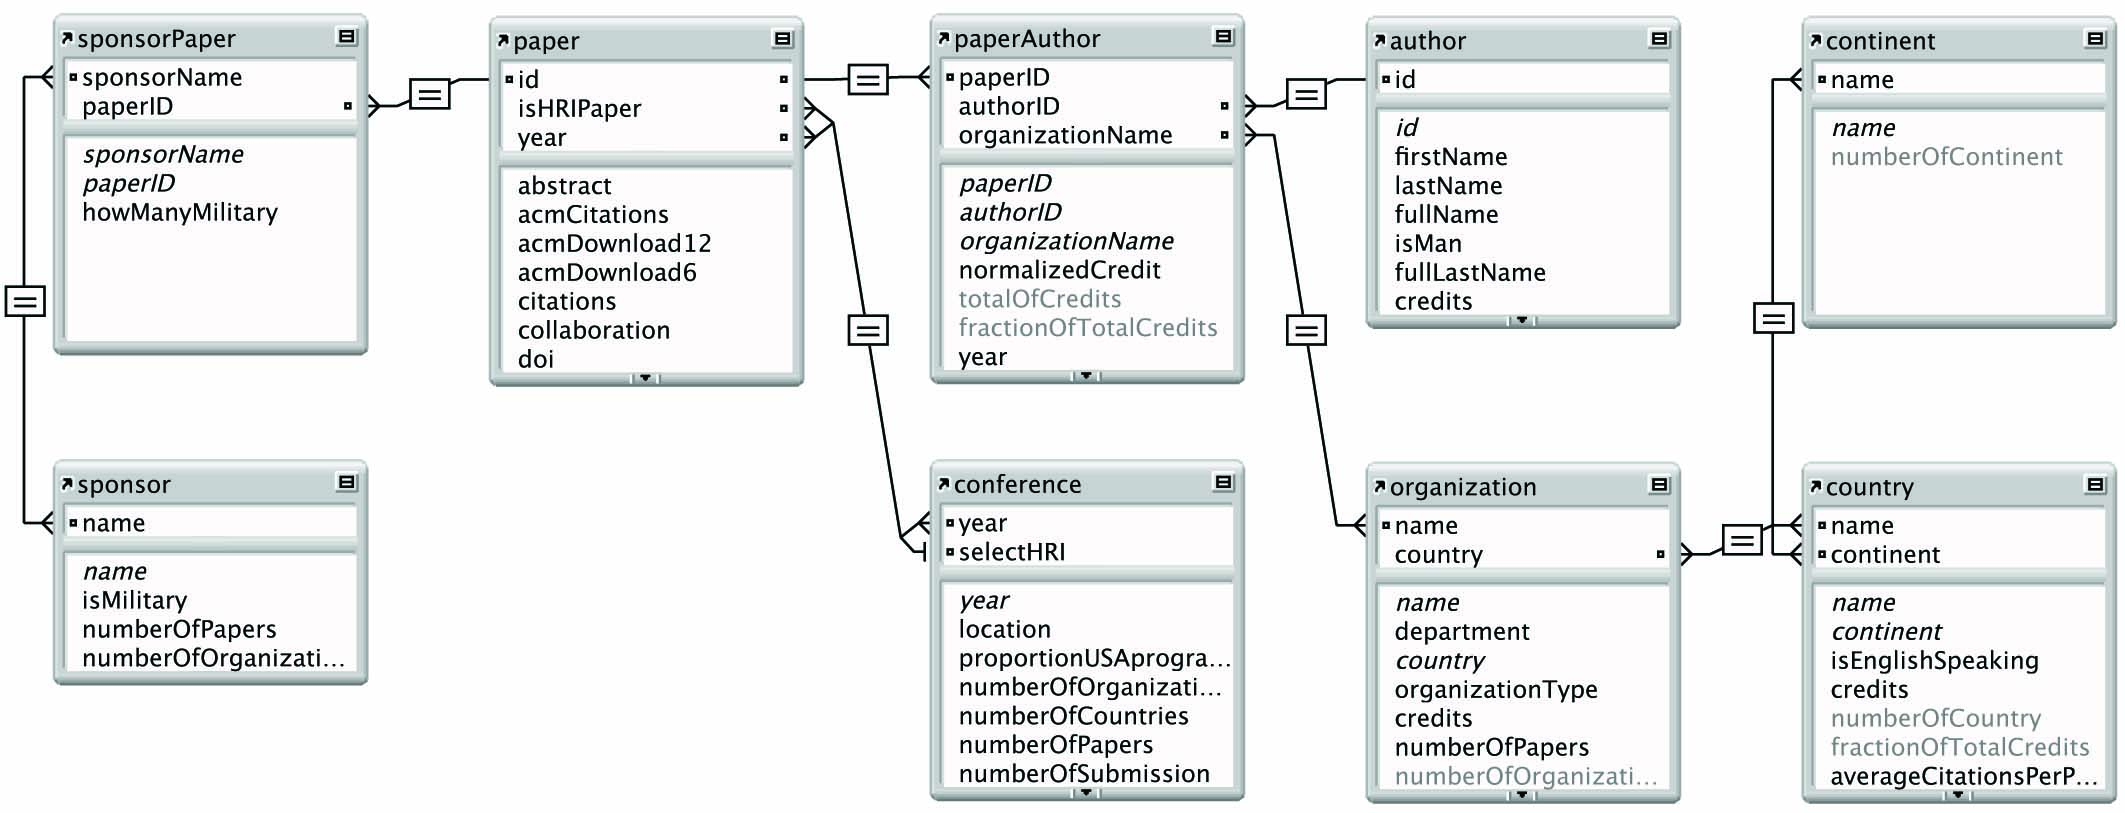
Fig. 2 Entity-Relationship Diagram
All authors and organizations have been confirmed manually to avoid ambiguity. For example, the records of the organization “MIT” were merged with the records for the “Massachusetts Institute of Technology”. The table ”organziations” (see figure 2 ) only contained unique records. The gender of the authors has been manually confirmed through a web search in case of ambiguous first names. Table 1 presents statistical data of the HRI conference for the years 2006-2010. Some terms used in the table require a definition:
- Full Paper: a publication in the section of the HRI proceedings that is included in the ACM’s calculation of the conference’s acceptance rate.
- Long poster: a publication that was presented as a poster at the conference. It had the same length restriction as a full paper.
- Short poster: a publication with up to two pages that was presented as a poster at the conference. The short posters were not peer reviewed in the years 2009 and 2010.
- Returning author: an author that has authored at least one full paper in any of the previous years.
- Number of countries: count of different countries in which the authors’ organizations are located. This does not equal the nationality of the authors.
- Number of organizations: count of different organizations to which the authors are associated.
- Credit: One full paper equals one credit. Credits are divided equally amongst all authors. For example, for a paper that has been authored by author x and y, x and x’s organization receives 0.5 credit. The same applies for author y and y’s organization.
- Military funding: a full paper is funded by the military if the acknowledgement section includes a declaration that the research was sponsored by a funding agency that is associated to a Department of Defense. Examples of such agencies are DARPA or the Office for Naval Research. This does not imply that the paper is about a weapon system or that the funding agency expects a military application.
- GS citation: Citation count from Google Scholar.
- ACM citation: Citation count from the ACM Digital Library.
- HRI reference: a reference to any manuscript or video that was published at the HRI conference.
- Self reference: A reference to any of the authors’ own papers.
- Local collaboration: All authors are from the same organization.
- Domestic collaboration: All authors are from the same country, but from at least two different organizations.
- International collaboration: Authors are from at least two organizations that are located in at least two different countries.
- Technical focus: the paper’s main intention is to propose new technology.
- Psychology focus: the paper’s main goal is to understand human behavior in response to robots.
- Design focus: the paper is associated to the creative arts or is focusing on the design process of a HRI system.
I used a bibliometric analysis of the HRI proceedings to gain insights into the structure of the conference and its community of researchers. Bibliometric analysis is based on the assumption that a citation carries value. A paper that is highly cited is assumed to be of high value. The success of Google’s search algorithm is based on a similar approach. A web page that is highly linked is likely to be valuable and thereby appears higher up in the list of search results. The impact factor for journals is another example of a bibliometric indicator [9]. The H-index is a robust indicator to evaluate researchers, journals and organizations [13]. A researcher has a H-index of six if at least six of his papers have each at least attracted six citations. This index has recently gained a considerable popularity. You can easily determine your own H-index by using the free program “Publish or Perish”. It includes a wealth of indicators that go far beyond the H-index.
The use of bibliometric indicators has become increasingly popular and their application has even been considered for the 2008 Research Assessment Exercise (RAE) in the United Kingdom [22]. There are likely to be included in some format in the upcoming Research Excellence Framework (REF) without replacing the established peer review [6]. The use of bibliometric indicators is of course not without its critics and MacRoberts & MacRoberts highlighted some of the conceptual problems of citation analysis [17].
One of the critical issues of a bibliometric analysis is the choice of a data source. The ISI Web of Science is a popular service, since it offers highly structured and consistent data. Its coverage of scientific literature is, however, very limited in comparison to Google Scholar [18]. I therefore used the citations counts from Google Scholar (GS) and the ACM Digital Library. The citations were gathered on March 10-12, 2010. The analysis focuses on the full papers of the conference and does not include posters or videos, although their count is listed in Table 1 .
| 2006 | 2007 | 2008 | 2009 | 2010 | average | ||
|---|---|---|---|---|---|---|---|
| papers | submitted papers | 140 | 101 | 134 | 120 | 124 | 123.8 |
| accepted papers | 41 | 23 | 48 | 23 | 26 | 32.20 | |
| acceptance rate | 0.29 | 0.23 | 0.36 | 0.19 | 0.21 | 0.26 | |
| long poster | 25 | (24)* | 24.50 | ||||
| short poster | 21 | 58 | 64 | 47.67 | |||
| videos | 12 | 10 | 13 | 11.67 | |||
| total of accepted works | 62 | 48 | 60 | 91 | 103 | 72.80 | |
| authors | number of authors | 110 | 65 | 159 | 64 | 91 | 97.80 |
| proportion female authors | 0.25 | 0.29 | 0.28 | 0.31 | 0.33 | 0.29 | |
| number of returning authors | 23 | 36 | 28 | 33 | 30.00 | ||
| proportion of returning authors | 0.354 | 0.226 | 0.438 | 0.363 | 0.35 | ||
| demographics | attendance | 146 | 167 | 222 | 166 | 234 | 187.00 |
| number of countries | 9 | 5 | 11 | 4 | 7 | 7.20 | |
| number of organizations | 35 | 18 | 50 | 20 | 24 | 29.40 | |
| location conference | USA | USA | NL | USA | JP | ||
| location PC meeting | USA | USA | UK | USA | USA | ||
| proportion of USA PC member | 0.81 | 0.78 | 0.57 | 0.65 | 0.60 | 0.68 | |
| credits USA | 29.50 | 17.67 | 24.13 | 13.40 | 17.40 | 20.42 | |
| proportion of USA credits | 0.72 | 0.77 | 0.50 | 0.58 | 0.67 | 0.65 | |
| collaboration | proportion local | 0.017 | 0.034 | 0.014 | 0.026 | 0.031 | 0.02 |
| proportion domestic | 0.005 | 0.004 | 0.005 | 0.013 | 0.004 | 0.01 | |
| proportion international | 0.002 | 0.006 | 0.002 | 0.004 | 0.003 | 0.00 | |
| average authors per paper | 3.59 | 3.35 | 3.71 | 3.83 | 3.77 | 3.65 | |
| std dev authors per paper | 1.63 | 1.85 | 1.43 | 1.75 | 1.37 | 1.60 | |
| focus | proportion technical | 0.629 | 0.666 | 0.606 | 0.654 | 0.586 | 0.63 |
| proportion psychology | 0.161 | 0.193 | 0.193 | 0.152 | 0.178 | 0.18 | |
| proportion design | 0.209 | 0.141 | 0.201 | 0.194 | 0.237 | 0.20 | |
| citations | average gs citations per paper | 23.51 | 16.91 | 7.52 | 3.61 | 0.04 | 10.32 |
| std dev gs citations per paper | 20.95 | 12.00 | 5.90 | 2.84 | 0.20 | 8.38 | |
| average acm citations per paper | 4.85 | 4.26 | 1.73 | 0.09 | 0.00 | 2.19 | |
| std dev acm citations per paper | 4.30 | 3.15 | 1.57 | 0.29 | 0.00 | 1.86 | |
| average proportion HRI references | 0.00 | 0.04 | 0.06 | 0.13 | 0.09 | 0.06 | |
| std dev proportion HRI references | 0.00 | 0.05 | 0.10 | 0.12 | 0.08 | 0.07 | |
| average proportion self reference | 0.20 | 0.18 | 0.16 | 0.15 | 0.19 | 0.18 | |
| std dev proportion self reference | 0.14 | 0.13 | 0.11 | 0.09 | 0.23 | 0.14 | |
| military | number of military funded papers | 9 | 6 | 6 | 4 | 6 | 6.20 |
| proportion of military funded papers | 0.22 | 0.26 | 0.13 | 0.17 | 0.23 | 0.20 |
Table 1 Statistics of the HRI conference 2006-2010 (*24 of the full papers in 2008 were presented as posters, but are considered full papers in the proceedings)
Results
Growth
The conference was able to attract a stable number of submissions that average around 124 (see Table 1 ). After an initial wave of papers in 2006, which resulted in 41 accepted papers, the number of accepted papers and thereby the acceptance rate declined considerable. The 2007 conference started to distinguished two quality levels of papers: full papers that were presented orally and long poster papers. Both were of the same length, but the orally presented papers are considered premium since they give the authors much more exposure at the conference.
The Amsterdam conference in 2008 is exceptional in several respects. It was the first HRI conference outside the USA and in its proceedings it did no distinguish between papers that were presented orally or through a poster. The acceptance rate is therefore higher (0.36%) compared to the acceptance rate for the 2007 conference (0.23%). The 2007 conference also accepted 25 long papers as posters, but separated them in the proceedings. The long posters are therefore not included in the calculation of the acceptance rate for 2007.
The 2009 conference is a turning point for the conference, because only 23 papers were initially accepted, independently from whether they would be presented orally or as a poster. It would have been financially almost impossible to operate the conference with only 23 contributions, since many researchers are only allowed to attend conferences to which they have an active contribution. A third quality level of contributions was re-introduced: the short poster. This class of papers is not peer reviewed, is limited to two pages, and the ACM does not claim the copyright. For the majority of authors, this class is their ticket to HRI. The 2009 conference abandoned the long poster and thereby increased the gap between papers and posters. This structure was carried over to the 2010 conference.
This division between papers and short poster polarizes the contributions. Either a manuscript is excellent and is therefore accepted as a full paper, or it has to be castrated to only two pages and flushed into the conference through the non-peer reviewed channel. The long poster used to take the position in the middle and the reasons for its discontinuation are unclear.
One may speculate that the long poster might not have been of a sufficient quality to justify the full length. The 2008 conference can be used as a test this speculation. The proceedings do not distinguish between full papers and long poster and hence both classes of contributions had the same chance of attracting citations. Both classes have also the same length restriction. I calculated the H-index for the 24 full papers and the 24 long posters. Both had a H-index of nine, which means that both had at least nine papers that each had at least nine citations. The average number of citations for full papers (7.66, std dev = 6.30) is very close to the average for the long posters (7.37, std dev = 5.6). The histogram of papers per citations (see Figure 3 ) shows that there is no dramatic difference in the number of citations that full papers and long posters attract. The data provides some evidence that there might be no difference in how many citations these two classes of papers attract. This trend might change in the future. It appears that the 2008 program committee made a good choice not to be too rigid in their selection and thereby allowing the slightly imperfect papers to be presented as long posters.
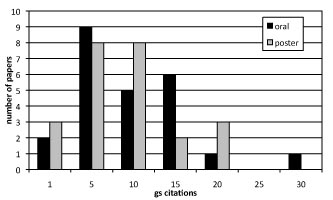
Fig. 3 Count of HRI2008 full papers and long posters that have 0-1,2-5,6-10,11-15,16-20,21-25 and 26-30 citations.
Demographics
The number of authors averages at around 98 and the 2008 conference has an exceptional high number of accepted authors (159). 97 of the 369 authors are women. The proportion of female authors is on average 29% with an increasing tendency. This proportion is above the proportion of female authors at the CHI conference of the same years [14]. The average proportion of returning authors to the HRI conference of 35%, on the other hand, is very close to the average of the CHI conference (37%). Figure 4 visualizes the attending authors of the HRI conference based on Joseph Jofish’ Kaye’s original design [14]. The graph lists all the authors for each year. Authors who published at the 2006 conference are colored in red. If they published in 2007, then they appear again in red at the bottom of the second column. On top are the authors who first published at the second conference in orange, and so on.
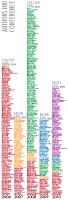
Fig. 4 Returning authors of the HRI conference
Internationalization
A conference that declares itself to be international in its title makes a commitment not to discriminate authors based on the location of their organization or based on their research culture. A conference that would carry the title “American Conference on Human Robot Interaction” would not be expected to have such a strong commitment towards internationalization. When looking at all the authors, it quickly becomes clear that the majority is coming from the USA. The statistics show that on average the USA alone is responsible for 65 percent of all credits (see Table 1 ).
In the first two years, the number contributions from the US were even higher, reaching up to 77% in 2007. Again, the 2008 conference stands out, since the proportion of US contributions was down to only 50%. The number of contributing organizations and countries was also the highest for this year, although one has to keep in mind that the 2008 proceedings considered long posters equal to full papers. If the 2007 proceedings had considered long posters equal to full papers, then the conference’s diversity would also have been higher. The difficult situation for the 2009 conference becomes clear when looking at the number of contributing organizations and countries. The authors for 2009 came from only 20 different organizations from 4 countries. In total, 55 papers have authors from non-English speaking, 122 papers have authors from English speaking country. 72 percent of the credits go to English speaking countries and 28 percent to non-English speaking countries.
A second source of information1 from the years 2009 and 2010 reveals that the acceptance rate for North American papers (30.5%) is substantially above the acceptance rate for other regions, such as Europe (7%), Japan (21.5%), or Asia/Oceania (5%).
An ongoing and very difficult debate circles around the composition of the program committee (PC). Since personal presence is often required for the PC meetings, the location of the PC meeting plays an important role for the composition of the PC. Researchers that do not have funding to travel to the PC meeting have difficulties accepting the role of a PC member. This trend can be observed when looking at the proportion of US PC members in those years where the PC meeting took place outside of the US. The lowest proportion can be observed for the year 2008 (0.58%) when the PC meeting took place in the UK and the conference itself in Amsterdam. Of course it is not yet possible to make a judgment if this relationship is statistical significant based on the very limited data available.
When we look at the collaboration of authors we notice that the international collaboration is on average only at 6% (see Table 1 ). The “strongest” collaboration can be found between the USA and Japan, which resulted in five co-authored papers. 72% of all contributions are from only one organization and 19% from organizations of the same country. On average 3.65 authors are associated with one paper, which is very close to the average of approximately 3.5 of the CHI conference for the years 2006-2010.
Content
Another field of tension at the HRI conference is inherent to all multi-disciplinary fields. The contributing sub-disciplines need to remain in a fine tuned balance. To get a first feeling for the field of HRI I composed a Wordle from the keywords of each paper (see Figure 5 ). The words robot(s), human(s), interaction, and HRI were excluded from the visualization to avoid a tautology. The first impression is that social communication and learning are important topics for the HRI community.
All papers were classified into being mainly focused on technology, psychology or design. This classification was made after reading the abstract of the paper and reviewing its content. Papers could be associated to more than one category. Table 1 shows that on average the two main HRI streams of technology and psychology are nearly equally represented. The focus on design is much weaker. From the 81 technical papers 53 have an evaluation with users. From the 93 psychological papers 89 have user evaluations and from the 11 design papers 4 have a user evaluations.
Citations
It takes time before a published paper attracts citations. After its initial release, it needs to be recognized by other researchers who will then include a reference to it in their own upcoming publications. The first citations can therefore only be expected one year after the original publication. The strong influence of the age of the publication on its citations becomes apparent from Figure 6 . The average citations per paper climbs from 2.84 for full papers from 2009 to 23.51 for the full papers from the year 2006. The citation frequency is likely to decay after some time, but the five-year focus of this analysis is not able to detect this decay.
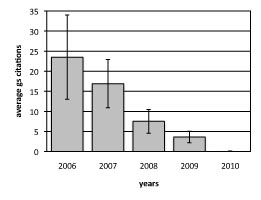
Fig. 6 Mean citations and standard deviation across years.
The citations are not equally divided across the papers for each year. The very high standard deviation (20.95 for 2006) indicates that the distribution is heavily skewed, as it has been previously observed for other fields [21]. Figure 7 includes the proportion of papers across citations.
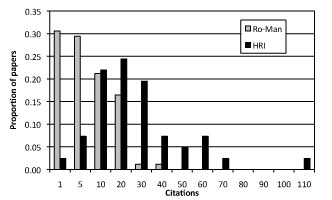
Fig. 7 Proportion of papers that have 0-1,2-5,6-10,11-20,21-30, ... and so, citations for both Ro-Man2006 and HRI2006.
The average number of citations of 23.51 for the year 2006 alone does of course not mean much. I therefore collected the papers from the 2006 Ro-Man conference and also harvested their citation counts from GS. The 85 papers of Ro-Man 2006 together have a H-index of 13 while the 41 papers of HRI from the same year have together a H-index of 18. The HRI papers received on average 23.51 citations (standard deviation is 20.94) and the Ro-Man papers received on average 5.95 citations (standard deviation is 6.50). Figure 7 compares the two conferences but due to the different number of papers for the two conferences it was necessary to display proportions rather than absolute counts of papers to guarantee a fair comparison.
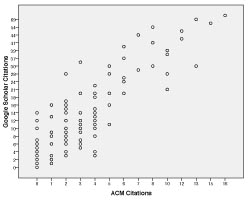
Fig. 8 Scatter plot of ACM/GS citations
The relationship between the GS citation and the ACM citations is of interest. The scatter plot of these two variables seem to suggested a linear relationship between them (see Figure 8 ). I performed a linear regression analysis to investigate the relationship between the GS citations and the ACM citations. GS citations and ACM citations are highly positively correlated (r = 0.88,n = 161,p < 0.001). The regression equation is citationsGS = 3.983 × citationsACM + 1.71. The model is able to explain 0.775% of the variance in the GS citations.
Ranking
The strong presence of organizations from the US has already been mentioned above. But a more detailed ranking of the contributing countries, organizations and researchers provides a much better insight into the conference. The USA has by far the most contributions to the conference (see Table 2 ). Japan holds a strong second position before the rest of the world follows, mainly from Western Europe.
| country | credits | % credits | papers | m. citations |
|---|---|---|---|---|
| USA | 102.098 | 0.634 | 106 | 12.047 |
| Japan | 24.819 | 0.154 | 28 | 10.321 |
| UK | 9.192 | 0.057 | 11 | 15.545 |
| Germany | 5.900 | 0.037 | 8 | 11.250 |
| Netherlands | 5.350 | 0.033 | 8 | 5.875 |
| France | 3.375 | 0.021 | 4 | 15.750 |
| Canada | 2.600 | 0.016 | 3 | 5.000 |
| Switzerland | 2.000 | 0.012 | 2 | 4.000 |
| Australia | 2.000 | 0.012 | 2 | 13.000 |
| New Zealand | 1.000 | 0.006 | 1 | 12.000 |
| Sweden | 1.000 | 0.006 | 1 | 40.000 |
| Spain | 1.000 | 0.006 | 1 | 5.000 |
| Austria | 0.429 | 0.003 | 1 | 0.000 |
| China | 0.400 | 0.002 | 1 | 0.000 |
| Singapore | 0.333 | 0.002 | 1 | 15.000 |
When we rank the contributing organizations we realize that the top 37 percent of organization are responsible for approximately 80 percent of the credits. The credits are spread out wider compared to the CHI conference where already 22 percent of the organizations are responsible for 80 percent of the credits [4]. CMU and ATR play an special role since they authored most papers at the conference (see Table 3 ). However, ATR’s and Georgia Tech’s average citations per paper are below the average of the top eight organizations. The best paper awards went to University of Notre Dame (2006), CMU (2007,2008,2009,2010) and ATR (2009). The last column entitled “military” presents the count of papers that have been funded by the military.
| organization | credits | % credit | papers | mean citations pp. | military |
|---|---|---|---|---|---|
| Carnegie Mellon University | 20.863 | 0.130 | 28 | 20.036 | 4 |
| ATR | 17.710 | 0.110 | 22 | 9.909 | 0 |
| Massachusetts Institute of Technology | 11.450 | 0.071 | 13 | 12.231 | 5 |
| Georgia Institute of Technology | 10.250 | 0.064 | 11 | 7.909 | 3 |
| University of Hertfordshire | 6.025 | 0.037 | 7 | 19.571 | 0 |
| Naval Research Laboratory | 5.274 | 0.033 | 9 | 24.778 | 5 |
| Brigham Young University | 4.443 | 0.028 | 6 | 36.167 | 2 |
| Stanford University | 4.350 | 0.027 | 6 | 2.833 | 0 |
| Yale University | 4.083 | 0.025 | 5 | 3.600 | 2 |
| Indiana University | 3.333 | 0.021 | 4 | 5.500 | 1 |
| Army Research Laboratory | 3.250 | 0.020 | 4 | 6.750 | 4 |
| University of Washington | 2.705 | 0.017 | 4 | 4.500 | 1 |
| Osaka University | 2.610 | 0.016 | 10 | 14.300 | 0 |
| MITRE Corporation | 2.533 | 0.016 | 4 | 15.250 | 2 |
| Eindhoven University of Technology | 2.400 | 0.015 | 4 | 5.250 | 0 |
Table 3 Ranking of top 15 organizations
Table 4 shows the ranking of the authors sorted by credits. Hiroshi Ishiguro, Takayuki Kanda and Norihiro Hagita form a triumvirate. Together they co-authored 20 papers. The difference in terms of credits between this triumvirate and other authors is less dramatic. This can be explained by looking at the average number of authors per paper. ATR’s 22 papers are authored on average by 4.8 authors, which is above the overall average of 3.65.
| author | organization | credits | papers |
|---|---|---|---|
| Hiroshi Ishiguro | ATR, Osaka Univ. | 4.87 | 22 |
| Takayuki Kanda | ATR | 4.62 | 21 |
| Norihiro Hagita | ATR | 4.23 | 20 |
| Jodi Forlizzi | CMU | 2.99 | 7 |
| Cynthia Breazeal | MIT | 2.33 | 5 |
| Michael Goodrich | Brigham Y. Univ. | 2.18 | 6 |
| Manuela M. Veloso | CMU | 1.92 | 5 |
| Brian Scassellati | Yale Univ. | 1.58 | 5 |
| Sara Kiesler | CMU | 1.53 | 6 |
| Kevin Gold | Yale Univ., | 1.50 | 2 |
| Vladimir Kulyukin | Utah State Univ. | 1.50 | 2 |
| Jessie Y.V. Chen | ARL | 1.50 | 2 |
| Christoph Bartneck | TU/e | 1.45 | 4 |
| Greg Trafton | NRL | 1.39 | 5 |
Table 4 Ranking of top 15 authors.
Military
The discussion about the association of the HRI community to the military first surfaced in public after Ronald Arkin’s presentation on “Governing lethal behavior: embedding ethics in a hybrid deliberative/reactive robot architecture” [1]. A panel on “Robo-Ethics” followed the presentation. The discussion continued at the 2009 HRI workshop on “Social Responsibility in HRI: Conducting our Research, Changing the World” and lead to a panel discussion at HRI2010 [8]. The ACM’s code of ethics encourages us to have these types of discussion in paragraph 1.2: “Furthermore, it is often necessary to assess the social consequences of systems to project the likelihood of any serious harm to others.” The IEEE’s code of ethics follows along the same lines in paragraph 5: “to improve the understanding of technology, its appropriate application, and potential consequences;”
Lets first have a look at some of the facts surrounding the ongoing discussion. The statistics show that only authors from US organizations accepted military funding that resulted in full papers at the HRI conference. These organizations are: Massachusetts Institute of Technology, Naval Research Laboratory, Carnegie Mellon University, Army Research Laboratory, Georgia Institute of Technology, Brigham Young University, Yale University, MITRE Corporation, University of Pittsburgh, University of South Florida, University of Southern California, George Mason University, Indiana University, University of Washington, University of Massachusetts, National Institute of Standards and Technology, Brown University, Micro Analysis & Design, Quantum Leap Innovations, New Mexico State University, and the iRobot Corporation.
Approximately 20 percent of the full papers are funded through the US Department of Defense (see Table 1 ). This does not mean that only the US develops robotic weapon systems and it also does not mean that only US researchers contribute to their development. We even cannot exclude the possibility that other papers at the HRI conference have been sponsored through a military agency. The analysis is based on the authors’ disclosure of their funding in their papers. We can also not assume that all research funded by the military has only military applications. The GPS system is an example of a military based technology that greatly contributed to the civil society. The HRI conference itself accepted financial support from the Naval Research Laboratory in the years 2006-2009. However, this support was restricted to support the travelling of students to the conference.
It is also a fact that the US is currently involved in several military operations. The US Active Duty Military Personnel is spread across the world: 78.598 in Europe, 143 in the Former Soviet Union, 47.976 in East Asia & Pacific, 5.606 in North Africa & Near East & South Asia, 1.501 in Sub-Saharan Africa, and 1.990 in the Western Hemisphere [5]. There are 164.100 active personnel in Iraq and 66.400 in Afghanistan. The two big US operations, Operation Iraqi Freedom and Operation Enduring Freedom, claimed together 5397 US casualties as of March 15th, 2010 [19]. The casualties on the US opponents side can be expected to be far higher.
Already today many robotic weapon systems are in use, such as the Predator or Reaper drones. Singer provides an excellent overview of the current state of robotic weapons systems and their possible influence on future societies [23]. The challenges and possible solutions for autonomous robots that engage in war have also been discussed [1, 16]. This discussion is necessary since already in 2009 the Air Force started to train more pilots to fly unmanned aerial systems than pilots to fly fighter or bomber aircraft [20].
I will not enter a discussion on if robotic weapon systems are acceptable from an ethical point of view or if any of the current armed conflicts are justified. Philosophy has been struggling with a definition of what is good for over 2000 years and no final answer has been found. But by raising important questions, philosophy has contributed to our deeper understanding of the problem. Instead I want to emphasize the role of personal choices. What follows is my personal viewpoint and should not be understood as anything else.
None of us can be expected to first gain a PhD in philosophy before working on HRI research, but it can be expected from us that we at least make a conscious choice about our own role in this world. Do you want to pull the trigger of gun in the trenches of Afghanistan? Do you want to be a member of the military at all? Do you want to develop weapon systems or are you willing to build surveillance systems? Are you willing to accept funding from the military? Do you refuse to live in a country that is actively involved in foreign military operations? Do you want to become a politician that advocates the reduction of the military and the promotion of peace? We all need to ask ourselves these questions and we should not deceive ourselves. It is very difficult not to contribute to the military at all. Some of our taxes finance the military and we cannot prevent the military from using our publicly available research results. But we can still make a choice on how close we want to be to the killing. Nobody is forcing us to join the army, accept military funding or to develop weapon systems. It remains our own choice and responsibility to consciously define our position based on our own ethical standards.
If we would constraint ourselves to individual positions and tolerance then we would of course not have the heated debates at the conference. What agitates many researchers is when the discussion gains a normative dimension. We do not like to be judged or disrespected by others. But we should also not fool ourselves in believing that we do not already have a norm concerning the acceptability of military funding, although this norm has never been formalized. To my knowledge, no paper was ever rejected due to its association to the military. The HRI community currently tolerates research that is funded by the military and that directly contributes to the development of robotic weapon systems.
The fundamental question is whether we want to change this policy. This would of course have a major effect on those members of the community that do fund their research through the military. Military funding has the distinct advantage that it allows for fundamental research to be conducted. The political commitment to military research takes it for granted that considerable investments have to be made to reach its goals [7]. The decision should therefore be based on a wide consent but it remains unclear how such consent can be reached and what an appropriate decision making process would be. Maybe this discussion will never mount to a change in policy, but it is certainly useful to have this discussion. It makes us all more sensitive to the issue and some of the contributions in the debate might even help clarifying our own positions and choices. And maybe the community will bit by bit choose not to develop weapons.
Conclusions
The data gathering and processing method used in this study largely relied on manual labor, which is only possible for a small dataset, such as the HRI conference. This process would have been impossible for larger conferences, such as CHI. Semi-automatic processing is necessary for such a large data set. It can also not be excluded that some minor errors occurred during the data entry. But repeated checks on the consistency and correctness of the data only revealed very few mistakes. It also appears that Google Scholar is collecting four times as many citations as the ACM. GS does indeed have a very good coverage of the scientific literature. Although there might be significant differences across disciplines [15], GS does appear to offer a more complete insight into the scientific literature. Still, the strong correlation also signifies that a more restricted citation index, such as the ACM DL, does at least go in the same direction as GS. If the ACM DL is able to identify many citations for a given paper, then GS is also likely to find many citations.
The papers published at already the first HRI conference received more citations than the papers of the Ro-Man conference of the same year. If you accept the assumptions that citations indicate some form of quality, then we may conclude that the HRI conference was able to attract higher quality papers. The motivation of the community to send their best papers to HRI and the rigid selection procedure may be responsible for this success.
Since the start of the HRI conference in 2006 several publication venues have emerged that are in direct competition to the HRI. The International Conference on Human-Robot Personal Relationship started in 2008, the Symposium on New Frontiers in Human-Robot Interaction and the International Conference on Social Robotics started in 2009. The IEEE International Symposium on Robot and Human Interactive Communication (Ro-Man) continues its long tradition. In addition, the International Journal of Social Robotics opened in 2009 and a new Open Access HRI journal is schedule for 2010. It is good to see that the research area of HRI is gaining momentum, but the HRI conference needs to continue to nurture its community. One danger the conference is facing is to alienate authors through is extremely rigid review process. Many authors will feel frustrated if more than 80% of the papers are being rejected.
The bottleneck is certainly not the available presentation slots at the conference. Instead, the bottleneck seems to be the available time during the PC meeting. Only a limited number of papers can be discussed. Given more time, the committee would have more opportunity to hunt for hidden treasures amongst the papers that did not receive an overall high score. These papers could then be accepted as long posters. The results of this study seem to suggest that the long posters in 2008 did not receive dramatically fewer citations than the orally presented papers. I would like to advocate tolerating slight imperfections in an attempt to embrace a wider HRI community. Also, it would appear fair if the PC meeting would move with the conference. This would automatically allow a more international group of people to contribute to the PC and the conference.
The extremely strong position of the US is only challenged by the continues high count of contributions from ATR. On average, 65 percent of the credits are associated to the US. Carnegie Mellon University, the Massachusetts Institute of Technology and Georgia Institute of Technology are the strongest contributors from the US and CMU was able to gain four out of five best paper awards. While we do have to congratulate these organizations for their success, we also need to be wary of some possible negative effects of this strong US representation.
The differences in the acceptance rate across geographic areas might lead some people to believe that the review process favors US contributions. Given the majority of US members in the PC, this speculation could even be associated to facts. We should avoid jumping to conclusions too quickly. The limited available data does not allow a meaningful statistical analysis yet. We can therefore not determine if the acceptance rate for North American papers is indeed significantly higher. For now, we have to constrain ourselves to descriptive statistics.
One could explain this result by claiming that maybe European authors do not send their best work to HRI or that the US is simply conducting research that is better than everybody else’s. And this might even be true. But a bitter aftertaste remains and no matter if this is a form of jealousy or not, it still has the potential to discourage contributions from non-US researchers. This may result in a self-reinforcing negative cycle, in which European authors do not send their work to HRI because they think there is an US bias. And there is a US bias because European papers are not submitted. Again, the 2008 conference sets a good example for a diverse and balanced conference and I hope that future conference will revive its spirit.
The bibliometric analysis presented in this paper does of course not help us to make an ethical discussion about the status of military funding. For this we need to consider the societal framework in which our research is conducted. Although both ACM and IEEE encourage us to consider and discuss the consequences of the technology we develop, neither is making an explicit statement about weapon systems. Paragraph 1.2 of the ACM’s Code of Ethics states that: “This principle prohibits use of computing technology in ways that result in harm to any of the following: users, the general public, employees, employers.” If we would include citizens of all countries in the definition of “the general public”, then we should not develop weapon systems, which are clearly intended to harm others. I confronted the chair of the ACM/IEEE-CS joint task force on Software Engineering Ethics and Professional Practices (SEEPP) with this view and he clarified that:
The Code says cause no harm, but notice how the focus is on accidental, negligent, malpractice based harm. The second paragraph uses the phrase ”unintentional harm” [”Well-intended actions, including those that accomplish assigned duties, may lead to harm UNEXPECTEDLY. In such an event the responsible person or persons are obligated to undo or mitigate the negative consequences as much as possible. One way to avoid UNINTENTIONAL harm ... ] meaning that in some cases it is acceptable to design a system which will cause harm. The Codes are designed to allow for the development of weapon systems conceived as an exercise in self-defense. [10]
The problem for researchers that are working on weapon systems is that they cannot control if their work will only be used as an exercise in self-defense. The researcher’s own definition of self-defense might even differ from the government’s. Is the war in Afghanistan and Iraq really an act of self-defense? I am not able to provide an answer to this question, but it is important to continue to discuss it.
I have to admit that I am not convinced that the development of new weapon systems will contribute to world peace. As a matter of fact I believe that the estimated $694.000.000.000 spend on the Iraq war by the US alone by 2010 [3] could have had a better use. For example, each and every of the 31 million Iraqis citizen could have received a $22.387 bribe for not attacking the US. Given their average annual income of $787 (estimate from 20082), they could have sent most of the population into pension (each for a duration of 28 years).
Footnotes
- Data is based on the 2009 and 2010 conference. The nationality is based on the affiliation of the first author. The data source is the 2010 internal report to the HRI steering committee.
- Source: WolframAlpha
Acknowledgments
This study was support by the Nara Institute of Science and Technology (NAIST) and the Advanced Telecommunication Institute International (ATR).
References
- R. C. Arkin. Governing lethal behavior: embedding ethics in a hybrid deliberative/reactive robot architecture. In Proceedings of the 3rd ACM/IEEE international conference on Human robot interaction, pages 121–128, Amsterdam, The Netherlands, 2008. ACM.
- L. Barkhuus and J. Rode. From mice to men24 years of evaluation in chi. Twenty-fith annual SIGCHI conference on Human factors in computing systems - Alt. CHI, 2007.
- J. E. Barnes. Cost of iraq war will surpass vietnam by year’s end, April 11 2009.
- C. Bartneck and J. Hu. Scientometric analysis of the chi proceedings. In Conference on Human Factors in Computing Systems (CHI2009), pages 699–708, Boston, 2009. ACM.
- D. M. D. Center. Active duty military personnel strengths by regional area and by country, 2009.
- Z. Corbyn. Hefce backs off citations in favour of peer review in ref, 18 June 2009 2009.
- H. Dou. In which business are we? Scientometrics, 30(2):401–406, 1994.
- N. Freier, A. Billard, H. Ishiguro, and I. Nourbakhsh. Panel 2: social responsibility in human-robot interaction. In Proceeding of the 5th ACM/IEEE international conference on Human-robot interaction, pages 11–11, Osaka, Japan, 2010. ACM.
- E. Garfield. The history and meaning of the journal impact factor. Journal of the American Medical Association, 295(1):90–93, 2006.
- D. Gotterbarn. Email reply to christoph bartneck ”re: Acm’s code of ethics”, April 14th 2010.
- S. Greenberg and B. Buxton. Usability evaluation considered harmful (some of the time). In Twenty-sixth annual SIGCHI conference on Human factors in computing systems, pages 111–120, Florence, Italy, 2008. ACM. 1357074 111-120.
- N. Henry, H. Goodell, N. Elmqvist, and J.-D. Fekete. 20 years of four hci conferences: A visual exploration. International Journal of Human-Computer Interaction, 23(3):239 – 285, 2007.
- J. E. Hirsch. An index to quantify an individual’s scientific research output. Proceedings of the National Academy of Sciences of the United States of America, 102(46):16569–16572, 2005.
- J. J. Kaye. Some statistical analyses of chi. In Proceedings of the 27th international conference extended abstracts on Human factors in computing systems, pages 2585–2594, Boston, MA, USA, 2009. ACM.
- K. Kousha and M. Thelwall. Sources of google scholar citations outside the science citation index: A comparison between four science disciplines. Scientometrics, 74(2):273–294, 2008.
- P. Lin, G. Bekey, and K. Abney. Autonomous military robotics: Risk, ethics, and design. Technical report, Ethics and Emerging Sciences Group at California Polytechnic State University, 2008.
- M. MacRoberts and B. MacRoberts. Problems of citation analysis. Scientometrics, 36(3):435–444, 1996. 10.1007/BF02129604.
- L. I. Meho and K. Yang. Impact of data sources on citation counts and rankings of lis faculty: Web of science versus scopus and google scholar. Journal of the American Society for Information Science and Technology, 58(13):2105–2125, 2007. 10.1002/asi.20677.
- D. of Defence. U.s. casualty status, March 15, 2010 2010.
- W. Pincus. Air force training more pilots for drones than for manned planes, Tuesday, August 11 2009.
- P. O. Seglen. The skewness of science. Journal of the American Society for Information Science, 43(9):628–638, 1992. 10.1002/(SICI)1097-4571(199210)43:9¡628::AID-ASI5¿3.0.CO;2-0.
- B. W. Silverman. Comment: Bibliometrics in the context of the uk research assessment exercise. Statistical Science, 24(1):15–16, 2009.
- P. W. Singer. Wired for war : the robotics revolution and conflict in the twenty-first century. Penguin, New York, 2009.
This is a pre-print version | last updated May 5, 2011 | All Publications