DOI: 10.1007/s11192-016-2176-y | CITEULIKE: 14217832 | REFERENCE: BibTex, Endnote, RefMan | PDF ![]()
Bartneck, C. (2017). Reviewers' scores do not predict impact - Bibliometric Analysis of the Proceedings of the Human-Robot Interaction Conference. Scientometrics. | DOI: 10.1007/s11192-016-2176-y
Reviewers scores do not predict impact - Bibliometric Analysis of the Proceedings of the Human-Robot Interaction Conference
HIT Lab NZ, University of Canterbury
PO Box 4800, 8410 Christchurch
New Zealand
Abstract - The peer review process is an essential component for the progress of science. The ACM/IEEE International Conference on Human-Robot Interaction is the prime publication channel for the field and this study evaluates its peer review process. The results show that the number of accepted papers are unevenly distributed across countries, organizations and authors. The contributions from the US outweigh all others contributions. A Binary Logistic Regression analysis showed that only for 85.5% of the papers the reviewers’ scores accurately predict its acceptance or rejection. Moreover, there was no significant correlation between the reviewers’ scores and the citations the papers later attract. 73% of the authors only ever submitted one paper and the proportion of newcomers at the conferences ranges from 63-77%.
Keywords: Human-Robot Interaction , HRI, conference , proceedings , acceptance rate
Introduction
The ACM/IEEE International Conference on Human-Robot Interaction (HRI) is considered the prime publication venue of the field. Despite its relative youth, its proceedings attract more citations than more established conferences in the field (Bartneck 2011). On average, the conference published 136 papers per year which ranks it at place number 15th of all 199 conferences listed at the ACM website. Figure 1 shows the downloaded papers and available for download papers of all 199 ACM conferences. The HRI conference, highlighted in red, occupies a middle position, which is an excellent position for a conference that exists only for ten years. The Conference on Human Factors in Computing Systems and the International Conference on Computer Graphics and Interactive Techniques reign supreme with 765k and 556k downloads in the last year.
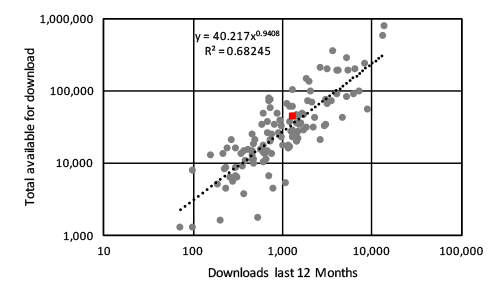
Fig. 1 Papers available for download and actually downloaded on a logarithmic scales.
Maintaining its exceptional level of quality requires continues monitoring of its key operation. This article attempts to evaluate the conference’s core function, namely its peer review process and operations. The conference justifies its prestigious status with its low acceptance rate. This comes at a time when it becomes increasingly clear that maintaining a high rejection rate in itself does not lead to a high impact (Matthews 2016). This conventional belief was refuted by Rocha da Silva (2015), who showed that there is only a very weak relation between the two (r = 0.0023). His analysis was based on 570 scientific journals that made their rejection rates available openly. He took the impact factor from The Journal Citation Index. We repeated his analysis on the data provided and came to slightly different results. There was a significant correlation between the rejection rate and the impact factor (r = 0.145,n = 570,p < 0.001) but the effect size is only small. Still, the recently performed experiment with papers submitted to the Neural Information Processing Systems (NIPS) conference does give us reason to be concerned about the arbitrariness of the peer review process. The NIPS conference attracted 1838 papers submission in 2015 which resulted in 10,625 reviews by 1524 reviewers. Managing the review process for such a large conference is complex, but it also enables researchers to investigate the process itself. In the NIPS experiment, 166 (10%) of the papers submitted to conference was put through the peer review process twice (Price 2014; Langford 2015). Price (2014) concluded that “most papers at NIPS would be rejected if one reran the conference review process”. Already Peters and Ceci (1982) showed that the reliability of the peer review process is not as good as hoped for.
Problems surrounding the peer review process are as old as the process itself and have been discussed at length. Despite the criticism, it remains a key component for the progress of science. Entertaining examples of the controversies around the peer review process include an article written by Peter Vamplew that solely consisted of 863 repetition of the sentence “Get me off your f****** mailing list” that was accepted at the “International Journal of Advanced Computer Technology” (Safi 2015). To be fair, it also included several scientific graphs of the same content.
More serious investigations into the practise of the peer review process include a sting targeted at open access journals by John Bohannon (2013). He wrote a bogus article that contained clear scientific errors and submitted it to 304 journals. Far too many journals accepted the bogus article, even if the reviewers had pointed out its problems. But not only dubious open access journals accepted the article, also journals published by Elsevier, Wolters Kluwer, and Sage accepted it. This might all be extreme, or at least funny examples of problems surrounding the peer review process, but even highly rigorous and professional conferences have the obligation to empirically asses their operation. There is not reason why organizations that are committed to the scientific method should avoid being the subject of such a scientific investigation.
Many studies that investigate the peer review process and impact factors base their analysis on the publicly available information on the published articles. It is much harder to include rejected articles in the analysis since this information is not publicly available and organisations are even hesitant to make such data available since a rejection is a negative result for the authors. The NIPS experiment is a notable exception, but their landmark investigation came at a cost. 166 papers required the double number of reviewers. Analysing accepted papers allows us to study false positives. Namely papers that received high scores from the reviewers, but failed to have any impact. It is well documented that the impact articles produce are dependent on their discipline (Glänzel and Moed 2002), but even within the standards of their disciplines, articles can fail to have impact. What is more important to note is that normally we cannot study false negatives, articles that were initially rejected but developed a considerable impact after their publication.
Campanario (1995) reported on eight articles that were initially rejected and later earned the authors Nobel Prizes. He continued to identify articles from Nobel Prize winning researchers that encountered considerable resistance in their initial publication attempts (Campanario 2009). Given that the HRI conference is rejecting around 75% of the papers submitted we need to wonder if the conference might have missed hidden gems. Moreover, continuously rejecting authors might reduce their motivation to submit again.
In collaboration with the steering committee of the conference and the system administrator of the conference submission system we were able to gain access to the meta data of all papers submitted to the HRI conference since 2009. Earlier data from the review process was no longer available from the submission system. We could, however, use some of the data available from (Bartneck 2011) to fill some of the gaps. A more detailed description of the data usage is availble below.
This study performs a bibliomentric analysis of the accepted and rejected papers of the HRI conference. More specifically, we are interesting in answering the following research questions:
- How did the conference develop in terms of submissions and acceptance rate?
- What is the acceptance rate depending on the number of authors on an paper?
- Does collaboration across organization increase citations?
- Do papers from some countries get accepted more often than papers from other countries?
- What are the most successful organizations?
- What is the distribution of accepted and rejected papers across authors?
- What is the distribution of accepted and rejected papers across topics?
- What is the relationship between the reviewers’ scores and the acceptance of an paper?
- What is the relationship between the reviewers’ scores and the citations papers receive?
- What is the author retention of the conference?
In Section 2 we will discuss the method adopted in the study before presenting the detailed results in Section 3. In section 4 we discuss the results before presenting the limitations of this study in section 5.
Method
The HRI conference used the Precision Conference Solution. The system administrator of this online service made the information about the submissions available for the years 2009-2016. The data included information about the title, abstract, authors and organization. A limited version of this data for the years 2006-2008 was already used by Bartneck (2011) and then appended to the database created for this work. Both ACM and IEEE, were consulted about this study and both gave their permission to collect the data and use it for the analyses presented in this paper. The study was furthermore discussed at the HRI conference steering committee meeting in March 2016 and recommendations for increasing the level of anonymity were implemented.
In this study, one full paper equals one credit. Credits are divided equally amongst all authors. For example, for an paper that has been authored by author x and y, x and x’s organization receives 0.5 credit. The same applies for author y and y’s organization.
2.1 Author and organization matching
We manually identified and matched all the authors and organizations to entries in the database. New records for authors and organizations were added if they did not yet exist. This process allowed us to handle the variations in names, such as “MIT” and “Massachusetts Institute of Technology”. Each organization was then matched to a country and a continent. This classification only takes the location of the organization into account and not the nationality of the authors.
2.2 Citations and Number of Online Versions
The citations for each paper were manually copied from Google Scholar and ACM Library (DL) into our database. Google Scholar has been demonstrated to have the wider coverage of citations (Bar-Ilan 2008; Meho and Yang 2007) in particular for researchers in the wider field of Human-Computer Interaction to which HRI is closely related (Meho and Rogers 2008). When comparing the citation counts from ACM DL and Google Scholar we notice again that the former has a much wider coverage (see Figure 2). This confirms our previous analysis of the comparison (Bartneck 2011). We therefore used the Google Scholar data in the remaining analysis in this study.
Google Scholar lists all versions of an paper that are available online. The paper might, for example, be available through the ACM Digital Library, the authors’ personal webpage, Research Gate and the authors’ organisational repository. The more freely an paper is available, the higher the chances that it might be read and cited. We manually transferred the number of available versions from Google Scholar into our database.
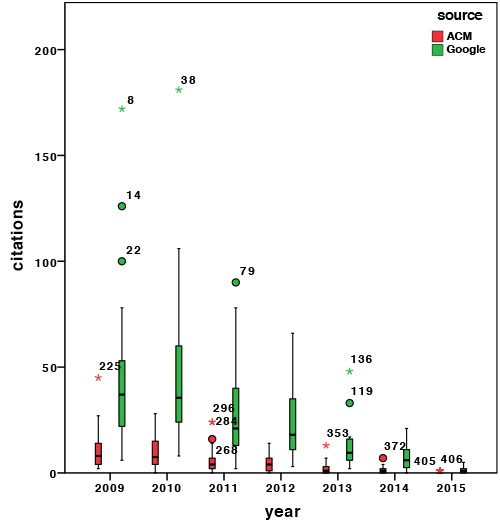
Fig. 2 Citations across time group by source.
2.3 Rejected papers
The title, abstract and authors for rejected papers of the 2009 conference were uploaded to the TurnItIn system, an online plagiarism checker. This system then automatically searched the web for similar documents. Based on this initial information about similar documents we manually verified each match. This allowed us to identify where the papers were published after the rejection from the 2009 conference. Due to the considerable effort necessary to accurately identify the publication of rejected papers we had to limit our analysis to the papers from the year 2009. We selected this year since this is the earliest year for which data is available and hence it gives the papers the longest duration to attract citations.
3 Results
3.1 Descriptives
The conference shows a constant grows of submitted papers and an acceptance rate which appears to be constant at around 25% for the last five years (see Figure 3). For the remainder of the analysis we will focus on the years 2009-2016, unless stated otherwise, since only papers in this range have all the required meta data associated to it.
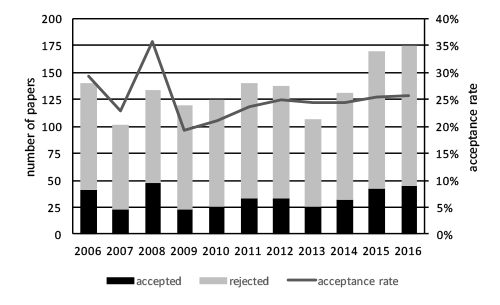
Fig. 3 Submissions and acceptance rate across time.
When we look at the number of authors contributing to an paper we notice that the majority of papers is authored by two to four authors (see Figure 4). Monographs are rare and their acceptance rate is only 18%. Not surprisingly, collaboration with other authors does seem to have a positive effect.
This does not necessarily mean collaboration with other institutions. 65% of all submissions are from authors of the same institution. Their acceptance rate (29%) is not much different from papers that have been authored by researchers from two (33%) or three (31%) different organizations. Only 8% of the papers involve more than two organizations. We performed a analysis of covariance (ANCOVA) with collaboration (one or more than one organization) as the independent variable, the citations received in 2015 as the dependent variable and the year of publication, number of authors and number of online versions as the covariants. Collaboration had no significant effect (F(1,18.869) = 1.546,p = 0.229,ηp2 = 0.076) on the citation count whereas the year of publication (F(9,10.693) = 9.955,p < 0.001,ηp2 = 0.893) and the number of online versions (F(1,307) = 26.328,p < 0.001,ηp2 = 0.079) had a significant influence on the number of citations. The older the paper and the more version of it are available the higher the citation rate is. There was no interaction effect between collaboration and year.
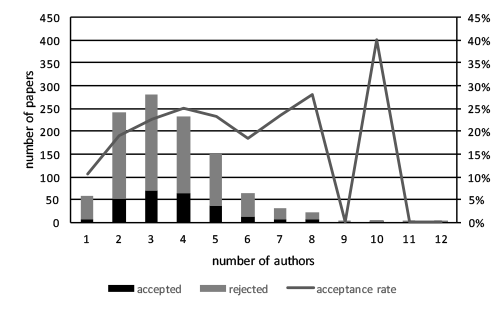
Fig. 4 Submissions and acceptance rate across number of authors (2009-2016)
Each author is associated to an organization for each paper which in turn is located in a country. Hence we can calculate the credits for each country for both accepted and rejected papers (see Table 1). From this we can then calculate the acceptance rate for each country. The USA had more accepted credit (152.5) than all other countries combined (110.04). Japan follows with 174.44 submitted credits and only 38.37 accepted credits which equals an acceptance rate of only 22%. Germany submitted the third most credits to the conference (87.06) but due to its low acceptance rate of 10% only 8.99 accepted credits can be recorded. Germany’s acceptance rate is thereby nearly a quarter that of the USA.
We performed a Chi Square test (adjusted for group size) to investigate the relationship between the country and the acceptance of the authors’ contributions. There was a significant association between the country and the acceptance of the papers (χ2(46) = 424.049,p < 0.001,ϕ = 0.325). The relationship between the accepted credits and rejected credits was investigated using the Pearson product-moment correlation coefficient. Preliminary analyses were performed to ensure no violation of the assumptions or normality, linearity and homoscedasticity. There was a strong, positive correlation between the two variables (r = 0.943,n = 47,p < 0.001). Countries that had many rejection credits also had many accepted credits. Only six out of the top twenty organizations are not located in North America. The acceptance rate for the organizations also range from 72% to 23%.
| Country | Accepted | Rejected | Total | Rate |
| Israel | 3.72 | 1.25 | 4.97 | 0.75 |
| USA | 152.50 | 263.68 | 416.17 | 0.37 |
| Switzerland | 5.80 | 11.08 | 16.88 | 0.34 |
| Portugal | 4.50 | 9.72 | 14.22 | 0.32 |
| UK | 14.20 | 34.93 | 49.13 | 0.29 |
| Canada | 8.48 | 23.28 | 31.76 | 0.27 |
| Finland | 1.67 | 4.83 | 6.50 | 0.26 |
| Greece | 1.00 | 3.00 | 4.00 | 0.25 |
| United Arab Emirates | 1.00 | 3.21 | 4.21 | 0.24 |
| Japan | 38.37 | 136.08 | 174.44 | 0.22 |
| New Zealand | 2.67 | 11.37 | 14.03 | 0.19 |
| Denmark | 2.19 | 11.72 | 13.91 | 0.16 |
| Belgium | 1.00 | 6.13 | 7.13 | 0.14 |
| Austria | 1.81 | 11.33 | 13.14 | 0.14 |
| France | 6.75 | 46.69 | 53.44 | 0.13 |
| Netherlands | 4.40 | 32.73 | 37.13 | 0.12 |
| Germany | 8.99 | 78.07 | 87.06 | 0.10 |
| Australia | 2.00 | 18.40 | 20.40 | 0.10 |
| China | 0.53 | 6.25 | 6.78 | 0.08 |
| Poland | 0.14 | 2.14 | 2.29 | 0.06 |
| Sweden | 0.33 | 15.34 | 15.67 | 0.02 |
| Singapore | 0.25 | 12.49 | 12.74 | 0.02 |
| Italy | 0.25 | 19.58 | 19.83 | 0.01 |
| Korea | 0.00 | 23.25 | 23.25 | 0.00 |
| Spain | 0.00 | 10.55 | 10.55 | 0.00 |
| India | 0.00 | 10.17 | 10.17 | 0.00 |
| Turkey | 0.00 | 5.80 | 5.80 | 0.00 |
| Other | 0.00 | 4.75 | 4.75 | 0.00 |
| Brazil | 0.00 | 3.90 | 3.90 | 0.00 |
| Mexico | 0.00 | 3.83 | 3.83 | 0.00 |
| Taiwan | 0.00 | 3.00 | 3.00 | 0.00 |
| Ireland | 0.00 | 2.00 | 2.00 | 0.00 |
| Hungary | 0.00 | 1.50 | 1.50 | 0.00 |
| Algeria | 0.00 | 1.00 | 1.00 | 0.00 |
| Iran | 0.00 | 1.00 | 1.00 | 0.00 |
| Morocco | 0.00 | 1.00 | 1.00 | 0.00 |
| Pakistan | 0.00 | 1.00 | 1.00 | 0.00 |
| Slovenia | 0.00 | 1.00 | 1.00 | 0.00 |
| Romania | 0.00 | 0.92 | 0.92 | 0.00 |
| Peru | 0.00 | 0.86 | 0.86 | 0.00 |
| Tunisia | 0.00 | 0.60 | 0.60 | 0.00 |
| Egypt | 0.00 | 0.50 | 0.50 | 0.00 |
| Thailand | 0.00 | 0.50 | 0.50 | 0.00 |
| Lebanon | 0.00 | 0.33 | 0.33 | 0.00 |
| South Africa | 0.00 | 0.25 | 0.25 | 0.00 |
| Czech Republic | 0.00 | 0.20 | 0.20 | 0.00 |
| Russia | 0.00 | 0.20 | 0.20 | 0.00 |
Table 1 Accepted and rejected credit per country (2009-2016)
2555 unique authors submitted papers to the conference and most of their papers were rejected. Since 2009 alone, 2416 unique authors submitted papers. Figure 5 shows the number of authors (bubble size) that have accepted and rejected papers. There is a clear relationship between the number of rejected and accepted papers. Authors that have many accepted papers also have many rejected papers. We conducted a regression analysis and there is a significant correlation (R2 = 0.558,p < 0.001) between the number of accepted and rejected papers.
On the one hand, there is a small number of highly productive authors. On the other hand, there are 1451 authors who submitted only one paper which was rejected and 415 authors who submitted one paper which was accepted. Only 552 authors can claim to have more accepted than rejected papers.
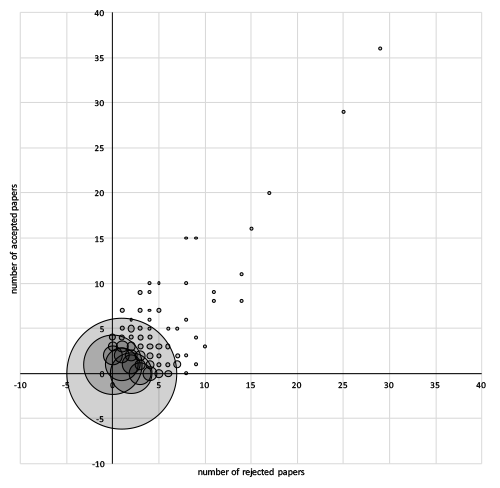
Fig. 5 Number of authors with accepted/rejected papers.
3.2 Topics
Authors who submitted to the 2009-2014 editions of the HRI conference had to categorize their contributions into one of these categories:
- MM: Methods & Metrics: contributions primarily focused on improving methods and metrics for HRI.
- RPA: Robots, Perception & Autonomy: any methods primarily concerned with how robots perceive, learn, and perform in their environment, including embodied systems and agents (humans, robots, etc.), autonomous robotics, and dynamic phenomena.
- HRIC: HRI Communication: any studies primarily concerned with how people and robots communicate, including interfaces used to command robots.
- HRR: Humans’ Responses to Robots: any studies primarily concerned with how people perceive robots and their attitudes toward robots.
- RIC: Robots in Context: any studies primarily concerned with how robots affect the broader context in which they are embedded and handle the challenges of real world environments
- CONF: Conceptual/Foundational: non-empirical studies that are primarily concerned with presenting a concept for consideration by the HRI community
- OTHER
| category | rejected | accepted | total | rate |
| CONF | 31 | 4 | 35 | 0.11 |
| HRIC | 183 | 66 | 249 | 0.27 |
| HRR | 157 | 54 | 211 | 0.26 |
| MM | 73 | 10 | 83 | 0.12 |
| OTHER | 3 | 0 | 3 | 0.00 |
| RIC | 30 | 12 | 42 | 0.29 |
| RPA | 63 | 17 | 80 | 0.21 |
| RPP | 44 | 11 | 55 | 0.20 |
Table 2 Number of accepted and rejected papers per topic (2009-2014)
Papers that were classified as being of the HRIC and HRR type greatly outnumber all other types. This indicates that most papers focus on the communication between humans and robots. The acceptance rate for CONF and MM papers was only half of that of most other types. This highlights the conference’s emphasis on empirical work.
In the years 2012-2014 authors had to classify their papers also to making a contribution to one of the following fields: Human Centred, Technology Centred, and Human and Technology Centred. Table 3 shows the distribution of papers per field. The acceptance rate of the Human and Technology Centred field is only half of that of other fields.
| field | rejected | accepted | total | rate |
| Human and Technology Centred | 100 | 41 | 141 | 0.29 |
| Human Centred | 138 | 45 | 183 | 0.25 |
| Technology Centred | 45 | 6 | 51 | 0.12 |
Table 3 Accepted and rejected papers by field (2012-2014)
In the years 2015-2016 the conference started to use subcommittees to operate the program committee meeting. Authors no longer had to define a field or topic but instead had to submit their papers to one of the following committees: Designs, Knowledge, Methods, Studies, Technologies, Theory&Method.
The knowledge and method committees of 2015 were merged into a theory&method committee in 2016. Table 4 shows the number of accepted and rejected papers per committee. The acceptance rate for the committees was similar with the exception of the methods committee which did not accept any papers in 2015.
| committee | rejected | accepted | total | rate |
| Designs | 38 | 11 | 49 | 0.22 |
| Knowledge | 10 | 4 | 14 | 0.29 |
| Methods | 8 | 0 | 8 | 0.00 |
| Studies | 127 | 44 | 171 | 0.26 |
| Technologies | 58 | 23 | 81 | 0.28 |
| Theory&Method | 15 | 6 | 21 | 0.29 |
Table 4 Accepted and rejected papers per committee (2015-2016)
3.3 Peer Review
From the 1093 papers in the analysis, 1086 received at least three reviews, 199 received at least four, and 18 received at least five reviews. The average review scores for accepted and rejected papers are shown in Figure 6. It shows the reviewers’ average scores for each paper.
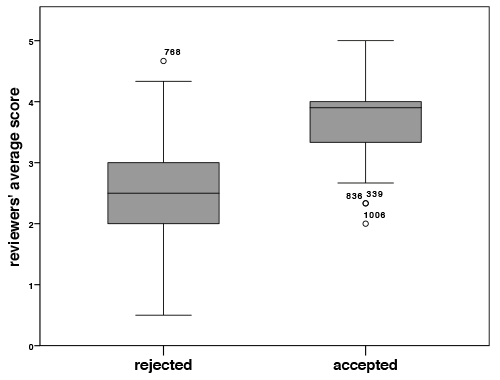
Fig. 6 Average reviewers’ scores for accepted and rejected papers.
We performed a Binary Logistic Regression analysis in which the acceptance/rejection of the paper was the dependent variable and the scores of the three reviewers were the independent variable. 1086 papers from the years 2009-2016 were included in the analysis of which 825 were rejected and 261 were accepted (see Table 5). The model was able to correctly classify 87.8% of the cases (χ2 = 602.869,p < 0.01,Cox&SnelR2 = 0.426). It is interesting to note that the model is far more accurate at predicting rejections (93.6%) than acceptances (69.3%). The model classifies only 181 out of the 261 as acceptable papers.
In addition to the reviewers’ scores, program committee members are likely to have promoted papers. 20 papers since 2009 had an average external reviewer score equal to or greater than 4, which carries the label “probably accept”, and were still rejected. Furthermore, one paper with an average reviewers’ score of equivalent or less than two was accepted. A score of two is labelled with “probably reject”.
The data shows that it seems to be easier to determine a bad paper than a good one. We repeated the regression analysis with four reviewer scores as the independent variables. Since less than half of the papers have more than three reviews, this resulted in the exclusion of those papers with three or less reviews, which in turn did not result in a higher prediction accuracy.
3.4 Blind Review Process
In the years 2015 and 2016 a double blind review process was introduced. This change could have negated any geographical bias. Unfortunately, these two years were also the first that used sub committees to evaluate submissions. It is therefore not directly possible to test the effect of the double blind review process by itself.
For an initial data exploration we compared the count of accepted and rejected papers using the chi square test in which the country and the type of review (blind vs. non blind) were the categories. We used the sum of accepted and rejected papers from the years 2013 and 2014 as the comparison to the sums from the years 2015 and 2016. Neither the number of accepted (χ2(22) = 15.533,p = 0.838) nor the number of rejected papers (χ2(42) = 40.334,p = 0.544) was significantly different across the various countries and review method. Next we ran a repeated measure ANOVA in which the type of review (blind vs. non-blind) was the within factor and the count of accepted/rejected papers and the acceptance rate were the measurements. Each country was one observation for this analysis. There was no significant difference between the type of review on any of the measurements.
| predicted | ||||
| decision | actual | reject | accept | % correct |
| reject | 825 | 772 | 53 | 93.6 |
| accept | 261 | 80 | 181 | 69.3 |
Table 5 Coefficients predicting whether an paper was accepted or not.
3.5 Citations
The year 2009 is the oldest year for which review data is available for accepted and rejected papers. 23 papers were accepted in this year and they are sorted by their citations in Figure 7. The top 23 rejected papers (out of 66) are also included. Figure 7 shows that the citations are unevenly distributed. A few papers receive many citations while most other receive only medium to few citations.
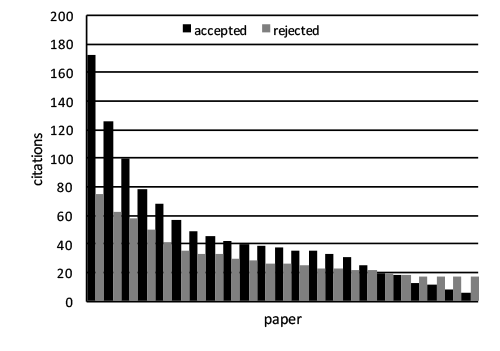
Fig. 7 Top 23 papers sorted by their citation count.
The accepted papers of 2009 had a slight advantage in attracting citations since they became available earlier than the rejected papers. To compensate for this advantage we subtracted the citations the accepted papers received by 2010 (as reported in Bartneck (2011)) from the citations count in 2015. We performed an analysis of covariance (ANCOVA) in which the status of the paper (accepted or rejected) was the independent variable, adjusted 2015 citations was the dependent variable and the average reviewers’ score was the covariant. The status of the paper had a significant (F(1,86) = 10.427,p = 0.02,ηp2 = 0.108) effect on the adjusted citations. The mean citations for accepted papers (m = 43.6522,std.dev. = 38.54349) was significant higher than the citations for rejected papers (m = 14.8182,std.Dev. = 15.73327). The average reviewers’ score had no significant (F(1,86) = 1.335,p = 0.251,ηp2 = 0.015) influence on the adjusted citation count.
3.6 Rejected papers
We investigated where and when the rejected papers were published. 73 papers (76%) were published despite their rejection from the HRI conference. 61 (64%) papers were published within the same year, six appeared in 2010 and three appeared later. Interestingly, we were able to identify three papers which were published before the HRI conference in 2009. These papers could be considered as self plagiarism.
58 papers (79%) were published in conference proceedings, 10 (13%) in journals and one as a book chapter. When we take a close look at the conference papers, we notice that 11 were published as a short paper in the proceedings of HRI 2009, eight as a full paper in the proceedings of ROMAN 2009 (The 18th IEEE International Symposium on Robot and Human Interactive Communication) and seven as a full paper in the proceedings of IROS 2009 (2009 IEEE/RSJ International Conference on Intelligent Robots and Systems) .
It appears that the filtering function of the peer review process does not work. The program committee could not prevent most of the rejected papers from being published within the same year. The peer review process can therefore only be considered a sorting process that matched papers with publication venues. The program committee of the HRI conference does, however, have little or no influence on whether authors resubmit their papers to another venue. The feedback they received thought the HRI review process does even give most authors a substantial opportunity to improve their papers. The program committee can only prevent papers to be published within their venue. But again, this has more in common with sorting than with filtering.
The vast majority of the papers were published in the proceedings of other conferences, which indicates the importance of such venues for the HRI community. Thus, ROMAN and IROS seem to be the closest related conferences to HRI.
3.7 Retention
Of the 2555 authors recorded in our database, 1866 (73%) submitted only one paper. 415 out of the 1866 (22%) had this one paper accepted. From these 415 authors, only 200 made at least one more submission of which 102 were successful. Table 6 shows the author retention over time, keeping in mind that the data from 2006-2008 only considers accepted papers. Newcomers for a given year are authors who had no previous submission at the conference. The conference has a high proportion of newcomers for each year, ranging from 63-77%. It is likely that these newcomers might be students.
One submission authors are those that only ever made one submission. This number naturally is higher for the more recent years since authors had less chances to make another submission. For the years 2010-2016 we can calculate the retention rate for submission. A retained author for a given year is an author who also submitted at least one paper in the previous year. The retention rate hovers around the average of 20%. The retention rate for accepted authors has an average of 29%.
| 2006 | 2007 | 2008 | 2009 | 2010 | 2011 | 2012 | 2013 | 2014 | 2015 | 2016 | |
| newcomers | 111 | 42 | 119 | 261 | 269 | 289 | 288 | 212 | 258 | 365 | 341 |
| % newcomer | 1.00 | 0.65 | 0.77 | 0.77 | 0.70 | 0.72 | 0.67 | 0.61 | 0.63 | 0.66 | 0.63 |
| total authors | 111 | 65 | 155 | 337 | 384 | 404 | 427 | 348 | 408 | 553 | 542 |
| one submission authors | 147 | 186 | 209 | 203 | 171 | 204 | 303 | 317 | |||
| submission retention | 91 | 77 | 95 | 78 | 60 | 96 | 126 | ||||
| % submission retention | 0.24 | 0.19 | 0.22 | 0.22 | 0.15 | 0.17 | 0.23 | ||||
| accepted retention | 23 | 17 | 66 | 17 | 18 | 27 | 22 | 22 | 21 | 32 | |
| % accepted retention | 0.35 | 0.11 | 1.05 | 0.19 | 0.18 | 0.23 | 0.25 | 0.20 | 0.14 | 0.22 | |
| total accepted | 111 | 65 | 155 | 63 | 91 | 102 | 119 | 89 | 109 | 147 | 147 |
Table 6 Retention of authors (2006-2008 considers only accepted authors)
4 Discussion
The HRI conference has grown continuously, although not spectacularly, in the last eleven years. The acceptance rate has been around 25% in recent years. Soon the conference will have grown to a size at which it will not be possible anymore to fit all contributions into a single track three day conference. Future chairs of the conference will have to either open a second track or extend the duration of the conference.
The vast majority of papers submitted and accepted at the HRI conference have multiple authors. Monographs are rare and have a low acceptance rate of only 18%. Papers are most often authored by a team of 2-4 researcher from the same organization. Collaboration across multiple organization does not increase the citation the paper attracts. The results of this study confirm the data presented by Bartneck and Jun (2010). Another interesting result from the analysis of the 2009 papers is that the citations they received significantly depends on the number of their versions available on Google Scholar. The majority of commercial publishers allow authors to post their papers on their own webpage or to store it in their institutional repositories. It has been shown before that making papers available online for free has a positive effect on citations (Lawrence 2001; Eysenbach 2006) and the proceedings of the HRI conference are no exception. Authors in the HRI community should be encouraged to make their manuscripts available.
The acceptance of papers across countries is not evenly distributed. Papers from some countries, such as the USA, are significantly more often accepted than papers from other countries. The USA has more accepted credits than all other countries combined. One might argue that the USA also submit most papers, but the USA also have the second highest acceptance rate. institutions from 23 countries made submission of which at least one was accepted while 24 institutions from 24 countries never had any paper accepted. The Republic of Korea is leading the list of unsuccessful countries with 23.25 rejected credits. The top 20 list of the most successful institution at the HRI conference is dominated by institutions from North America.
Of the 2416 authors that submitted an paper since 2009, 1451 had their paper rejected and never submitted a second paper. 415 authors had their paper accepted, but have not yet submitted a second paper. There is a clear relationship for highly productive authors between the number of accepted and rejected papers. Only 552 authors have been able to have more of their papers accepted than rejected. The retention rate for authors at the HRI conference is only 20%. Between 63-77%, depending on the year, of all authors at the conference are complete newcomers. This high fluctuation in authors at the conference can be explained by the great contributions that the students make to the conference. Only a small fractions of students that graduate continue to be active in HRI research.
The analysis of the acceptance rate depending on the topic of the paper revealed that the HRI conference has a strong preference for empirical work. The analysis of the sub fields revealed that technical papers had an acceptance rate only half that of human centered or technical and human centered papers. The acceptance rates for the subcommittees introduced in 2015 seem to be spread more evenly with the exception of the methods sub committee in 2015 which did not accept any papers.
The results show that it is much easier to predict the rejection of an paper (93.6%) than its acceptance (69.3%) based on the reviewers’ scores. Moreover, there is no correlation between the HRI reviewers’ scores and the citations an paper receives. It appears that the conference is more scared of accepting a mediocre paper than to reject a brilliant one. This might not be the best strategy for the conference since artificially high rejection rates do not automatically increase impact factors (Matthews 2016). The citations papers receive are also highly skewed. A few papers receive many citations while most papers receive few to no citations. We can still detect a significant effect of the acceptance of papers at the HRI conference. Accepted papers receive on average more citations than papers that were rejected at the HRI conference and then published in another venue. However, the reviewers’ scores are not related to the citations an paper attracts. Hence it seems that the papers gain prestige and attention through the acceptance at the HRI conference.
It appears that the HRI conference is good because the community believes that it is. This believe is nurtured by advertising a low acceptance rate. The popular believe is that an HRI paper must be good because it was selected in a highly competitive process. But the results show that the HRI review process is unable to predict future impact and that even the HRI conference has many papers that are rarely cited. The high status of the conference and its papers is therefore predominately based on a shared believe that cannot easily be backed up with data.
We were able to clearly identify 73 of the papers that were rejected in 2009 to be published in another venue. It can therefore be argued that the filtering function of the peer review process is barely working. Instead it would be better to focus the review process on helping authors to improve their paper following the “All-In Publication Policy” (Bartneck 2010).
In recent years several journals have emerged that operate on an impact neutral policy, such as the Frontier and PLOS series. These journals focus their review on the rigor of the method described in the submission and explicitly do not judge the potential impact the paper might have. This approach might become a guiding example for the conference. Since even the HRI conference is not able to predict future impact, it might be better to focus the review process on the rigor of the papers’ methods.
The constraints of scheduling the program of a conference can easily be separated from the acceptance of the papers. Not every paper accepted at the conference needs to occupy a full presentation slot. The 2008 HRI conference already demonstrated that papers can be presented as posters as well as through talks. Decoupling acceptance from the presentation format would allow the conference to become more inclusive while maintaining its impact.
Some steps have been taken to capture provocative papers that express less conventional research: the Alt.HRI paper track. It is designed to accepted those hidden gems which would not pass through the highly competitive and hence very conservative peer review process of the main paper track.
5 Limitations
One might argue that the authors of the rejected papers used the comments of the peer review process to improve their manuscripts before submitting it again. The eventually published papers would therefore be better and therefore more likely to attract citations. It is important to notice that the same can be assumed of the accepted papers. They would have also used the feedback to improve their papers. Nevertheless, this discussion needs to remain the focus of future work since we did not had the opportunity to investigate the differences between the initially submitted papers and their finally published versions.
We have to acknowledge that we focused our attention on the papers of the year 2009 since these were the earliest papers for which data was available. These papers had the longest period available to attract citations. The sample size of 23 accepted papers and 66 rejected papers does seem sufficiently large but it cannot be excluded that a larger sample size might produce more precise results. Additional resources for tracking rejected papers would be necessary to include further papers in our analysis.
Acknowledgements
The author would like to thank Utku Yalcin and Subha Krishna for the data processing.
References
- Bar-Ilan J (2008) Which h-index? a comparison of WoS, Scopus and Google Scholar. Scientometrics 74(2):257–271, DOI 10.1007/s11192-008-0216-y, URL http://dx.doi.org/10.1007/s11192-008-0216-y
- Bartneck C (2010) The all-in publication policy. In: Fourth International Conference on Digital Society (ICDS 2010), IEEE, pp 37–40, DOI 10.1109/ICDS.2010.14
- Bartneck C (2011) The end of the beginning - a reflection on the first five years of the HRI conference. Scientometrics 86(2):487–504, DOI 10.1007/s11192-010-0281-x
- Bartneck C, Jun H (2010) The fruits of collaboration in a multidisciplinary field. Scientometrics 85(1):41–52, DOI 10.1007/s11192-010-0242-4
- Bohannon J (2013) Who’s afraid of peer review? Science 342(6154):60–65, DOI 10.1126/ science.342.6154.60
- Campanario J (2009) Rejecting and resisting nobel class discoveries: accounts by nobel laureates. Scientometrics 81(2):549–565, DOI 10.1007/s11192-008-2141-5
- Campanario JM (1995) Commentary: On influential books and journal articles initially rejected because of negative referees’ evaluations. Science Communication 16(3):304–325, DOI 10.1177/ 1075547095016003004, URL http://scx.sagepub.com/content/16/3/304.abstract
- Eysenbach G (2006) Citation advantage of open access articles. PLoS Biology 4(5), DOI 10. 1371/journal.pbio.0040157, URL http://dx.doi.org/10.1371/journal.pbio.0040157
- Glänzel W, Moed HF (2002) Journal impact measures in bibliometric research. Scientometrics 53(2):171–193, DOI 10.1023/A:1014848323806, URL http://dx.doi.org/10.1023/A:1014848323806
- Langford J (2015) The NIPS experiment. URL http://cacm.acm.org/blogs/blog-cacm/181996-the-nips-experiment/fulltext
- Lawrence S (2001) Free online availability substantially increases a paper’s impact. Nature 411(6837):521–521, DOI 10.1038/35079151
- Matthews D (2016) High rejection rates by journals pointless. URL https://www.timeshighereducation.com/news/high-rejection-rates-by-journals-pointless
- Meho LI, Rogers Y (2008) Citation counting, citation ranking, and h-index of human-computer interaction researchers: A comparison of Scopus and Web of Science. Journal of the American Society for Information Science and Technology 59(11):1711–1726, DOI 10.1002/asi.20874, URL http://dx.doi.org/10.1002/asi.20874
- Meho LI, Yang K (2007) Impact of data sources on citation counts and rankings of LIS faculty: Web of Science versus Scopus and Google Scholar. Journal of the American Society for Information Science and Technology 58(13):2105–2125, DOI 10.1002/asi. 20677
- Peters DP, Ceci SJ (1982) Peer-review practices of psychological journals: The fate of published articles, submitted again. Behavioral and Brain Sciences 5(2):187–195
- Price E (2014) The NIPS experiment. URL http://blog.mrtz.org/2014/12/15/the-nips-experiment.html
- Safi M (2015) Journal accepts bogus paper requesting removal from mailing list. URL http://www.theguardian.com/australia-news/2014/nov/25/journal-accepts-paper-requesting-removal-from-mailing-list
- Rocha da Silva P (2015) Selecting for impact: new data debunks old beliefs. URL http://blog.frontiersin.org/2015/12/21/4782/
This is a pre-print version | last updated December 1, 2016 | All Publications