DOI: 10.1016/j.ijhcs.2007.03.003 | CITEULIKE: 1340650 | REFERENCE: BibTex, Endnote, RefMan | PDF ![]()
Bartneck, C., & Rauterberg, M. (2007). HCI Reality - An 'Unreal Tournament'? International Journal of Human Computer Studies, 65(8), 737-743.
HCI Reality — An ‘Unreal Tournament’?
Department of Industrial Design
Eindhoven University of Technology
Den Dolech 2, 5600MB Eindhoven, NL
christoph@bartneck.de
Department of Industrial Design
Eindhoven University of Technology
Den Dolech 2, 5600MB Eindhoven, NL
g.w.m.rauterberg@tue.nl
Abstract - The cooperation between designers, engineers and scientists in the human–computer interaction (HCI) community is often difficult, and can only be explained by investigating the different paradigms by which they operate. This study proposes a paradigm model for designers, engineers and scientists, using three barriers to separate the professions. We then report on an empirical study that attempted to validate the understand/transform world barrier in the paradigm model using an online questionnaire. We conclude that the used ‘Attitude About Reality’ scale was unsuitable for measuring this barrier, whereas information about the educational background of the participants was a good predictor for the self-reported profession (designer, engineer or scientist). Interestingly, among the three professions, engineers appear to be the cohesive element, since they often have dual backgrounds, whereas very few participants had dual science/design backgrounds. Engineers could, therefore, build a bridge between designers and scientists, and through their integrative role, could guide the HCI community to realizing its full potential.
Keywords: Human–computer interaction; Community; Paradigm; Design; Engineering; Science; Attitude About Reality
1. Introduction
The human–computer interaction (HCI) community is diverse. Academics and practitioners from science, engineering and design contribute to its vivid development, but communication and cooperation between the different groups is often challenging. The Association for Computing Machinery (ACM) Computer Human Interaction (CHI) conference, which is the largest and arguably one of the most important conferences in the field, is organized through the Special Interest Group Computer Human Interaction (SIGCHI). At the 2005 SIGCHI membership meeting, discussion of the CHI2006 conference ignited a shouting match between academics and practitioners (Arnowitz and Dykstra-Erickson, 2005). The intensity of the situation could be compared to scenes from the multiplayer video game, ‘Unreal Tournament’. Both groups defended their access to the conference through the different publication formats, such as paper sessions, panels, and case studies, similar to how, ‘Unreal Tournament’ players fight for markers in the ‘domination’ game mode. This outbreak of emotion illustrates the tension between the different groups and it can be explained by taking a closer look at the paradigms by which they operate, and at the barriers that separate them. Snow (1964) was the first to talk about such barriers, even though he focused on only two cultures: the scientific and the literary intellectuals. While his political ideas have become somewhat obsolete with the decline of the USSR, his vision for the benefits of cooperating experts still holds:
The clashing point of two subjects, two disciplines, two cultures—of two galaxies, so far as that goes—ought to produce creative chances. In the history of mental activity that has been where some of the break-throughs came. (Snow, 1964, p. 16)
After addressing these theoretical aspects, we will present an empirical study that attempts to verify one of the barriers between the paradigms and discuss its consequences. A better understanding of the different paradigms within the HCI community could help to prevent wasting any additional time and energy on shouting matches, and could lead to a mutual beneficial cooperation.
‘Paradigm’ is defined in the Kuhnian sense as a disciplinary matrix that is composed of those (a) shared beliefs, (b) values, (c) models, and (d) exemplars that guide a community of theorists and practitioners (Kuhn, 1970). We propose three barriers that can be used to distinguish the paradigms of the three different disciplines (see Fig. 1): designers {D}, engineers {E} and scientists (in particular social scientists), {S}:
- knowledge representation (explicit {S, E} versus implicit {D});
- view on reality (understanding {S} versus transforming reality {D, E}); and
- main focus (technology {E} versus human {D, S}).
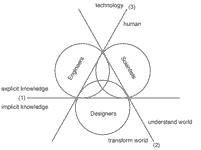
Fig. 1. Theoretically hypothesized paradigm model of designers, engineers and scientists with the three main barriers distinguishing them.
Barrier 1: Engineers {E} and scientists {S} make their results explicit by publishing in journals, books and conference proceedings, or by acquiring patents. Their body of knowledge is externalized and described outside of the individual engineer or scientist. These two communities revise their published results through discussion and control tests among peers. On the other hand, designers’{ D} results are mainly represented by their concrete designs. The design knowledge necessary to create these designs lies within the individual designer, mainly as implicit knowledge, often referred to as intuition (see Dorfman et al., 1996). To make better designs, the designer has to become more experienced. After gaining considerable experience and intuition, designers tend to reflect (Schön, 1991) and publish their views on design (Dorst, 2003). Even so, the foundation of these reflections lies within the individual designer’s experiences of reality.
Barrier 2: Engineers {E} and designers {D} transform the world into preferred situations (Simon, 1996; Vincenti, 1990), while scientists {S} mainly attempt to understand the world through the pursuit of knowledge covering general truths or the operation of general laws (definition taken from Encyclopaedia Britannica). This difference between {E, D} and {S} is of particular interest to our investigation since a preferred state could also be the state of knowing and since understanding also requires the use of synthesis. The following model illustrates the relationship between ‘abstracting’ from reality (for understanding) and ‘concretization’ (for transforming reality; see Fig. 2).
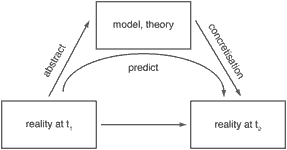
Fig. 2. Progress model (adapted from Rauterberg, 2006). Scientists create models and theories of reality through abstraction with the aim of predicting reality. Designers and engineers concretize the abstract models and theories into artifacts that improve reality.
Barrier 3: Scientists {S} and designers {D} are predominantly interested in humans in their role as possible users. Designers are interested in human values, which they transform into requirements and eventually solutions. Scientists in the HCI community are typically associated with the social or cognitive sciences. They are interested in the users’ abilities and behaviors such as perception, cognition and action. Engineers {E} are mainly interested in technology, which includes software for interactive systems. They investigate the structure and operational principles of these technical systems to solve certain problems.
Given a reality at time t1, science in the positivistic paradigm observes and analyzes particular phenomena in this reality, makes proper abstractions, and tries to predict similar phenomena for reality at time t2. To preserve a stable reality [reality(t1) = reality(t2)], science in the positivistic paradigm has to operate under the essential assumption that model and theory are not a part of reality { [{model, theory} ∉ {reality}]. The theory (‘res cogitans’) itself is clearly separated from and does not influence the described phenomena (‘res extensa’; see Descartes, 1644 and more recently Dreyfus, 1979, Chapter 7, and Blackmore, 1999, Chapter 17).
For example, the theory of gravity explains and predicts certain phenomena, such as falling apples, but it neither influences nor changes the phenomenon of ‘gravity’. In this sense, models and theories of science in our modern positivistic paradigm are not part of the investigated and described reality; but they are apart from this reality. For this concept of reality we will use the lowercase style. We will use the term REALITY in the uppercase style for the broader meaning of the term as the union of model, theory and reality. The underlying mechanism to guarantee the fulfillment of the assumption [reality(t1) = reality(t2)] is reductionism via abstraction. Any differences in empirical measurements and observations between t1 and t2; such as noise, are interpreted as just accidental factors, which do not contradict the theory and/or the underlying principle. Armed only with knowledge based on theories developed under the positivistic paradigm, the design of a concrete artifact is impossible, because the knowledge in these theories is purified from the concrete and changing contextual factors between reality at t1 and at t2. This lack of specific knowledge for any concretization, such as craft skills provided via experiences and intuition, gives design and engineering disciplines their right to exist. Dreyfus and Dreyfus (1992) and Dreyfus et al. (1986), stimulated a very important discussion about the importance and boundaries of and necessity for intuitive expertise, complementary to artificial expert systems which just follow explicitly given rules.
Therefore, activities governed by a constructivistic paradigm claim to influence the reality and to change this reality via the developed artifacts [reality(t1) ≠ reality(t2)], and in fact they do! The design and engineering disciplines develop knowledge to make concretization possible. This knowledge realized in the form of models and artifacts can be interpreted as part of the REALITY, and not apart from it [{model, artifact} ∈ {reality}]. But how can design and engineering disciplines guarantee a stable reality? If models and artifacts are seen as part of this REALITY, such as a subset of this REALITY under consideration, then any action, which changes this subset, changes the whole REALITY set as well. So, constructive disciplines such as design and engineering cannot guarantee a stable reality, and indeed they do not want to (Klemm, 1964).
Scientists, with their logical positivistic paradigm on the one side, and engineers and designers with their constructivistic paradigm on the other side, appear to have different attitudes toward REALITY. Our study attempted to find empirical proof of this difference. We hypothesized that the Attitude About Reality (AAR) scale (Unger et al., 1986) might be useful for measuring this difference. This bi-polar scale ranges from ‘logical positivism’ on the one side to ‘social constructivism’ on the other side. Unger et al. (1986) defines logical positivism as follows:
Reality is relatively fixed and objectively accessible. Logical positivism also states that meaning is operationally defined and therefore replicable across social contexts, and that reality will be increasingly uncovered by the use of more and more refined measurement techniques.
Social constructivism is defined by Unger et al. (1986) as follows:
Meaning is defined by our linguistic and conceptual categories; these categories are the product of socialconsensus process that is neither predictable nor progressive in nature. This view ‘invites one to challenge the objective basis of conventional knowledge’ (Gergen, 1985) and to focus instead upon processes of negotiated understanding as the critical events through which to analyze reality, as we know it. The degree to which a particular form of understanding prevails or is sustained across time is not seen as fundamentally dependent upon its empirical validity.
If scientists operate under the logical positivistic paradigm, then they should score higher on the AAR scale compared to designers and engineers that work under the constructivistic paradigm. Our main research question is whether the different paradigms of designers, engineers and scientists do indeed lead to different views on reality as measured through the AAR scale.
2. Method
We conducted a study in which the participant’s selfreported profession, their educational background and the AAR score was recorded. The data were gathered through an online questionnaire. Invitations to participate in the study were posted on several HCI mailing lists, including the ACM’s CHI-Announcements list, British HCI Group’s BCS-HCI news list and the German GI-Fachgruppe Software-Ergonomie SW-Ergo list. While online surveys have some methodological difficulties (Kaye and Johnson, 1999), such as the submission of duplicates, it still offers the broadest access to a given community. Our study focuses on the HCI community and not on the general public. Therefore sampling problems apply only to a lesser degree. It can be assumed that most HCI community members have access to a computer and the Internet.We checked the submission dates and times in combination with the IP addresses of the computer from which the survey was completed, to prevent duplicate submissions.
2.1. Measurements
First, the participants were asked to declare in what academic fields they had a bachelor’s, master’s or doctoral degree. The participants could select multiple answers, even within the different educational levels. They could also decide not to give an answer for a certain educational level. If, for example, the participant did not have a Ph.D. degree then they would not check any of the offered choices for the Ph.D. degree.
Given the diversity of educational programs it appeared to be unwise to include an open question for the academic fields. The option ‘Other’ was included to identify participants that diverged from the given set of academic fields. The scores on the educational background were transformed in the following manner. We categorized each education field as either design, engineering or science according to the following schema:
- Design: Architecture, Fashion Design, Industrial Design (Product, Packaging, etc.), Visual Design (Graphic, Interaction, Information, etc).
- Engineering: Bioengineering/Biomedical Engineering, Civil Engineering, Electrical Engineering, Environmental Engineering, Material Science and Engineering, Mechanical Engineering, Software Engineering.
- Science: Biology, Chemistry, Computer Sciences, Geology, History, Mathematics, Medicine, Philosophy, Physics, Psychology, and Sociology.
The schema might have a certain ambiguity. For example, it can be argued if Mathematics is really a science (Jaffe, 1997). Furthermore, its relationship to Computer Science and Software Engineering is not completely clear. However, it appears to have been generally categorized as a science by encyclopedias such as ‘Encyclopedia Britannica’.
Afterwards, the questionnaire inquired how participants would categorize their main profession as it is now: designer, engineer or scientist. This self-reported categorization was a forced choice selection question and they were not allowed to make multiple choices. Finally, the participants had to fill in the AAR questionnaire (Unger et al., 1986) which consisted of 40 questions. Each question had to be answered using a sevenpoint Likert scale (see Fig. 3). The answers of all inverse items were transformed before undergoing the analysis. The AAR score is the sum of all items ranging from a minimum of 40 to a maximum of 280 points.
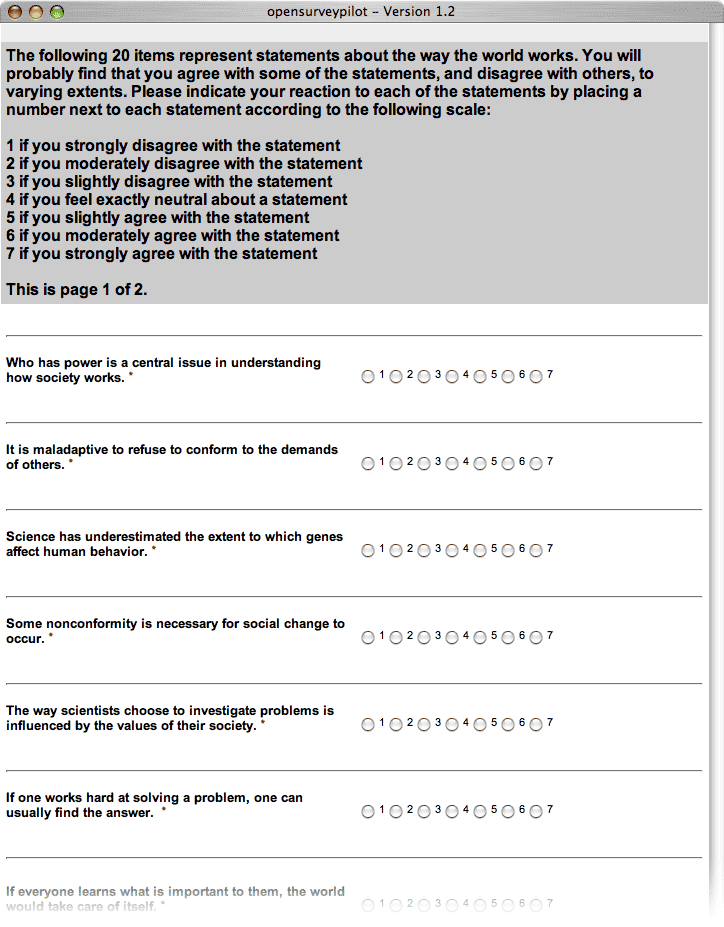
Fig. 3. Example screenshot of the questionnaire.
We then estimated how much time each participant spent in design (d), engineering (e), and science (s). Since the education systems vary among different countries we assumed that on average a bachelor’s degree requires four years, a master’s requires two years, and a Ph.D. requires four years of education. If a person had a bachelor’s in mechanical engineering (e) and a master’s in industrial design (d) then the person would receive a score of d = 2 and e = 4. In addition, we noted the highest educational level (eduLevel) of the participant (1 = bachelor’ s, 2 = master’ s and 3 = PhD.). In the above example, the highest level would have been the master’s degree. We then calculated the specialization of the participant (propEduInProfession). The number of years of education the participant spent on his/her profession were divided by the total years of education (d + e + s). If the participant in the previous example considers themselves to be a designer then their score would be propEduInProfession = 0.33 (2/6) and if they considered themselves to be an engineer then their score would be propEduInProfession = 0.66 (4/6). To summarize, we recorded the participants’ age, gender, profession, highest education degree (eduLevel), and AAR score. Based on an estimation of the participants’ education years in design (d), engineering (e), and science (s), we calculated the participants’ self-reported specialization (propEduInProfession).
2.2. Participants
Given the international scope of the various mailing lists to which the invitations were sent, it can be assumed that the participants originated from several different countries. Of the 128 people that filled in the questionnaire, a total of 114 were used for the analysis. Participants who indicated ‘Other’ for education were excluded from the analysis (N = 12), since no further information on them was available. The remaining 114 participants identified themselves as designers (N = 26), engineers (N = 33) and scientists (N = 55). Table 1 shows the gender and profession frequencies. More men (N = 81) than women (N = 33) participated in the study and most women were scientists. A χ2 test revealed no significant correlation between profession and gender (χ2 = 1.850; df = 2; p = 0.397). Table 2 summarizes the education levels per self-reported profession. Most participants had at least a master’s degree (N = 57) and the scientists in particular tended to have a Ph.D. degree (N = 26). A Chi-Square test revealed that there was a significant correlation (χ2 = 13.788; df = 4; p = 0.008) between profession and eduLevel.
| Self-reported profession | Total | |||
|---|---|---|---|---|
| Gender | Designer | Engineer | Scientist | |
| Female | 7 | 7 | 19 | 33 |
| Male | 19 | 26 | 36 | 81 |
| Total | 26 | 33 | 55 | 114 |
Table 1 Frequencies of gender and profession
| Self-reported profession | Total | |||
|---|---|---|---|---|
| Education level | Designer | Engineer | Scientist | |
| Bachelor | 5 | 9 | 6 | 20 |
| Master | 18 | 16 | 23 | 57 |
| Ph.D. | 3 | 8 | 26 | 37 |
| Total | 26 | 33 | 55 | 114 |
Table 2 Frequencies of the education levels per profession
3. Results
A reliability analysis for the 40 AAR items for all 114 participants resulted in a Cronbach’s alpha of 0.614, which gives us sufficient confidence in the reliability of this questionnaire. An analysis of variance (ANOVA) was conducted with self-reported profession as the independent variable and the total AAR score as the dependent variable. The Levene’s Test for equality of variance was not significant (p = 0.278) and therefore the variance can be assumed to be homogeneous. Profession does not have a significant influence on the total AAR (F(2,111) = 0.046, p = 0.955). The scores for designer (168.15), engineer (168.33) and scientist (167.42) were only slightly above the middle value of the AAR (160). Next, we conducted a factor analysis of the 40 items on the AAR scale using a varimax rotation. It revealed 13 factors with eigenvalues greater than 1 after 25 iterations. The interpretation of these 13 factors was not the main aim of our study.
A discriminant analysis was performed to determine to what degree the variables measuring the participants’ educational background (d, e, s, eduLevel and propEduInProfession) and gender, predicts the participants’ selfreported profession. Table 3 shows the pooled within groups correlation between the variables and the two discriminant functions. The variables s and eduLevel largely correlate with the first function while the remaining variables correlate with the second function. The variable propEduInProfession correlates with both functions, which comes as no surprise, since the proportion spent within a certain profession is independent of the professions themselves. Function 1 may be labeled ‘abstract orientation’ and function 2 ‘concrete orientation’. This interpretation would be congruent with Fig. 2, which illustrates the role of abstracting and concretizing in the progress of science.
| Function | ||
|---|---|---|
| 1 | 2 | |
| s | 0.397a | 0.018 |
| eduLevel | 0.242a | 0.180 |
| d | −0.498 | 0.755a |
| propEduInProfession | 0.513 | 0.565a |
| e | 0.006 | −0.542a |
| Gender | −0.075 | −0.160a |
Table 3 Pooled within groups correlation between the discriminating variables (d, e, s, eduLevel, propEduInProfession, gender) and the discriminant functions. a Largest absolute correlation between each variable and any discriminant function.
The sample data were randomly split into two groups. The first group was used for the creation of the discriminant model (original group) and the second group was used to validate the model (cross-validated group). In total 81.6% of the original cases and 77.2% of the crossvalidated cases were correctly classified by the discriminant model (see Table 4). Interestingly, designers are sometimes incorrectly classified as engineers, and engineers are sometimes wrongly classified as scientists. Scientists, however, are rarely classified as anything but scientists (see Table 4).
| Profession | Predicted group membership | Total | ||||
|---|---|---|---|---|---|---|
| Designer | Engineer | Scientist | ||||
| Original | Count | Designer | 16 | 10 | 0 | 26 |
| Engineer | 1 | 28 | 4 | 33 | ||
| Scientist | 1 | 5 | 49 | 55 | ||
| Cross-validated | Count | Designer | 16 | 10 | 0 | 26 |
| Engineer | 1 | 23 | 9 | 33 | ||
| Scientist | 1 | 5 | 49 | 55 | ||
Table 4 Predicted membership accuracy of the self-reported profession category based on the variables d; e; s; eduLevel; propEduInProfession, and gender
A second discriminant analysis was performed to investigate the predictive power of age, gender, educational background (d,e,s,eduLevel, propEduInProfession) and AAR on the participants’ profession (see Table 5).
| Function | ||
|---|---|---|
| 1 | 2 | |
| propEduInProfession | 0.505a | 0.472 |
| s | 0.381a | −0.029 |
| eduLevel | 0.237a | 0.141 |
| d | −0.459 | 0.767a |
| e | −0.007 | −0.510a |
| Age | −0.178 | −0.227a |
| Gender | −0.076 | −0.141a |
| AAR | −0.020 | −0.023a |
Table 5 Pooled within groups correlation between the discriminating variables (age, gender, educational background [d,e,s,eduLevel and propEduInProfession] and AAR) and the discriminant functions. a Largest absolute correlation between each variable and any discriminant function.
The sample data were randomly split into two groups. The first group was used for the creation of the discriminant model (original group) and the second group was used to validate the model (cross-validated group). The 79.8% of original cases and 74.6% of the cross-validated cases were correctly classified by the discriminant model. The classification accuracy did not improve (compare Tables 4 and Table 6). Including AAR as a predictor did not improve the prediction accuracy.
| Profession | Predicted group membership | Total | ||||
|---|---|---|---|---|---|---|
| Designer | Engineer | Scientist | ||||
| Original | Count | Designer | 16 | 10 | 0 | 26 |
| Engineer | 1 | 28 | 4 | 33 | ||
| Scientist | 1 | 7 | 47 | 55 | ||
| Cross-validated | Count | Designer | 16 | 10 | 0 | 26 |
| Engineer | 3 | 22 | 8 | 33 | ||
| Scientist | 1 | 7 | 47 | 55 | ||
Table 6 Predicted membership accuracy of the self-reported profession category based on the variables d, e, s, eduLevel, propEduInProfession, gender and AAR
4. Discussion and conclusion
Among our three chosen disciplines the differences in AAR are small and insignificant. The AAR scale appears to be ineffective in detecting the differences between designers, engineers and scientists. The results of the factor analysis strengthen this impression. Jackson and Jeffers (1989) identified only three factors of the AAR scale and labeled them, ‘societal determinism’, ‘individual determinism’, and, ‘variable determinism’. In contrast, our factor analysis revealed 13 different factors. This difference might be explained by the diversity of the participants in our study. Both, Jackson and Jeffers (1989) and Unger et al. (1986), used a homogenous populations (e.g., undergraduate psychology students), whereas our study included participants from diverse backgrounds and ages. The AAR scale appears to be ineffective for heterogenous groups, which is unfortunate, since its potential value lies in explaining differences between conflicting groups. In contrast, the educational background of the participants has a much higher prediction accuracy of 77–82% for the participants’ self-reported profession.
We therefore focus our further discussion on the educational backgrounds of the designers, engineers and scientists. The term ‘scientist’ is somewhat ambiguous. People may consider themselves to be scientists because they work for an academic institute or because they have a Ph.D. degree, or because they conduct scientific studies. An engineer working for a university might consider himself a scientist even if he only works on engineering tasks. Most medical doctors have a Ph.D. degree but work as general practitioners. However, to have a successful university/ academic career, it is generally necessary to have a Ph.D. degree, which understandably requires time. Our data show that 70% of the participants that consider themselves to be scientists have a Ph.D. degree and as a result, have spent more time on their education. Furthermore, propEduIn- Profession is the best predictor for scientists when all variables are considered (see Table 5). They tend to stay within the same scientific fields while engineers and designers change their fields more often. In general, the education history of a person predicts in over 80% of the cases their self-reported profession correctly. This result indicates the importance of the education for the development of professions and thereby the differentiations of the disciplines within the HCI community. Perhaps an overhaul of our education systems, to include more diverse courses, is required in order to obtain increased cooperation between disciplines. Designers could, for example, avail of basic courses in experimental methodology and statistics, while scientists could be granted access to interface design courses.
It also becomes apparent that engineers are the binding element between designers and scientists. Designers and scientists sometimes have an engineering education and engineers sometimes have a design or science education. In contrast, scientists and designers rarely have a design or science education, respectively. The intersection between science and design as shown in Fig. 1 appears to be small. A more realistic model of the people within the HCI community is shown in Fig. 4 in which the three disciplines are aligned with engineering in the centre, flanked on either side by science and design.
Engineering shares much of its knowledge with science (Vincenti, 1990) and it can be argued that on the very grounds on which the claim of superiority is made for scientific knowledge, engineering knowledge is shown to be far more reliable, secure and trustworthy than scientific knowledge (Pitt, 2001). Engineers require such knowledge to build artifacts on which our lives depend, e.g., cars and houses must be safe and engineers have no margin for error when evaluating the strengths of materials.
Since engineers are more likely to have education in multiple fields than scientists or designers, they tend to acquire the knowledge and skills of the other professions. This enables them to speak and empathize with the other fields. They therefore could bridge the gap between designers and scientists and guide the HCI community to its full potential. To do so they need to be open-minded and collaborate with both the disciplines. In general, people with educational backgrounds in at least two disciplines might play the key role.
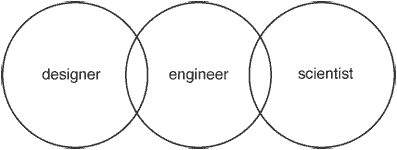
Fig. 4. Empirically improved paradigm model of designers, engineers and scientists.
5. Future work
This study tried to find empirical proof of the AAR barrier between scientists on the one side and engineers and designers on the other side (see Fig. 1) by utilizing the AAR questionnaire. Unfortunately, we found that the AAR questionnaire was unsuitable for this task. To further empirically evaluate our model of the HCI community, it would be necessary to systematically test all barriers. In addition, one could consider a variation of the methodology in which the participants would be allowed to give multiple-choice answers for the self-reported profession.
Acknowledgments
The authors would like to thank the participants of this study who took the time to complete the questionnaire and who provided relevant and interesting feedback. In addition, we would like to thank Paul Locher for his support and in particular Rhoda Unger for making the AAR questionnaire available to us. We also would like to thank Aoife Currid for editing the manuscript.
References
Arnowitz, J., & Dykstra-Erickson, E. (2005). CHI and the Practitioner Dilemma. Interactions, 12(4), 5-9. | DOI: 10.1145/1070960.1070964
Blackmore, S. J. (1999). The meme machine. Oxford [England] ; New York: Oxford University Press. | view at Amazon.com
Descartes, R. (1644). Principia Philosophiae. Amsterdam: Danielem Elzevirium.
Dorfman, J., Shames, V. A., & Kihlstrom, J. F. (1996). Intuition, incubation, and insight: implicit cognition in problem solving. In G. Underwood (Ed.), Implicit Cognition. Oxford, UK: Oxford University Press. | view at Amazon.com
Dorst, C. H. (2003). Understanding Design. Amsterdam: BIS Publisher. | view at Amazon.com
Dreyfus, H. L. (1979). What computers can't do : the limits of artificial intelligence (Rev. ed.). New York: Harper & Row.
Dreyfus, H. L., & Dreyfus, S. E. (1992). What computers still can't do : a critique of artificial reason. Cambridge, Mass.: MIT Press. | view at Amazon.com
Dreyfus, H. L., Dreyfus, S. E., & Athanasiou, T. (1986). Mind over machine : the power of human intuition and expertise in the era of the computer. New York: Free Press. | view at Amazon.com
Gergen, K. J. (1985). The social constructionistic movement in modern psychology. American Psychologist, 40, 266-275. | DOI: 10.1037/0003-066X.40.3.266
Jackson, L. A., & Jeffers, D. L. (1989). The Attitude About Reality Scale: A New Measure of Personal Epistemology. Journal of Personality Assessment, 53(2), 353-365. | DOI: 10.1207/s15327752jpa5302_12
Jaffe, A. (1997). Proof and the Evolution of Mathematics. Synthese, 111(2), 133-146. | DOI: 10.1023/A:1004903010713
Kaye, B. K., & Johnson, T. J. (1999). Research Methodology: Taming the Cyber Frontier-Techniques for Improving Online Surveys. Social Science Computer Review, 17(3), 323-337. | DOWNLOAD
Klemm, F. (1964). A history of Western technology. Cambridge,: MIT Press. | view at Amazon.com
Kuhn, T. S. (1970). The structure of scientific revolutions (2d ed.). Chicago: University of Chicago Press. | view at Amazon.com
Pitt, J., C. (2001). What Engineers Know. Techne, 5(3), 17-30.
Rauterberg, M. (2006). HCI as an engineering discipline: to be or not to be!? African Journal of Information and Communication Technology, 2(4), 163-184.
Schön, D. A. (1991). The reflective practitioner : how professionals think in action. Aldershot England: Arena. | view at Amazon.com
Simon, H. A. (1996). The sciences of the artificial (3rd ed.). Cambridge, Mass.: MIT Press. | view at Amazon.com
Snow, C. P. (1964). The two cultures: and a second look ([2d ed.). Cambridge,: University Press. | view at Amazon.com
Unger, R. K., Draper, R. D., & Pendergrass, M. L. (1986). Personal Epistomology and Personal Experience. Journal of Social Issues, 42(2), 67-79.
Vincenti, W. G. (1990). What engineers know and how they know it : analytical studies from aeronautical history. Baltimore: Johns Hopkins University Press. | view at Amazon.com
This is the authors personal copy | last updated February 5, 2008 | All Publications