DOI: 10.1007/978-3-319-22701-6_19 | CITEULIKE: 13774639 | REFERENCE: BIBTEX, ENDNOTE, REFMAN ,PDF ![]()
Obaid, M., Duenser, A., Moltchanova, E., Cummings, D., Wagner, J., and Bartneck, C. (2015). LEGO Pictorial Scales for Assessing Affective Responses. Proceedings of the IFIP TC.13 International Conference on Human-Computer Interaction - INTERACT 2015, Bamberg pp. 263-280.
LEGO Pictorial Scales for Assessing Affective Response
1t2i Lab, Chalmers University of Technology, Gothenburg, Sweden
2Digital Productivity, CSIRO, Australia
3Mathematics and Statistics Department, University of Canterbury, New Zealand
4Texas A&University, College Station, TX, USA
5Human Centered Multimedia, Augsburg University, Germany
6Human Interface Technology Lab New Zealand, University of Canterbury, New Zealand
Abstract- This article presents the design and evaluation of novel types of pictorial scales for assessing emotional response based on LEGO Minifigures. We describe the creation of two pictorial scales (LEGO Face Scale and Stylized LEGO Face Scale) through the use of a semi-automatic process. We report on the results of two evaluation studies conducted to assess the validity of the proposed pictorial scales. The first study evaluated the rating of emotions expressed by other humans; the second focused on rating one’s own emotional state when looking at expressive stimuli. We investigate the validity of the two pictorial scales by comparing them to ratings given on a conventional Likert Scale. Results show that assessing expressive faces using the proposed pictorial scales can differ from using a Likert scale; however, when rating one’s own emotional state there is no difference. Finally, we assembled a physical version of the LEGO Face scale and discuss future work.
Keywords - LEGO Minifigures, Evaluation, Pictorial, Emotion, Scale
The Questionnaire Sheet is available under the Attribution-NonCommercial-NoDerivatives 4.0 International license.
Introduction
Emotional assessment plays an important role in the field of Human-Computer Interaction(HCI) as it provides an understanding of the user’s state and emotional response when interacting with physical/digital content of a system. Capturing a person’s emotion can be an important factor informing the design or re-design of a product. One of the main methods used to assess emotions is by having a person expressthem verbally or through a questionnaire. These questionnaires mostly ask the person to pick from a written set of emotions and rate the intensity, for example, on a Likert scale. This is supposed to capture the person’s current emotional state, an experienced emotion, the emotion of somebody else or the emotional loading of an object. Text-based (non-pictorial) scales require a person to read through a list of possible answers and pick the most appropriate alternative. This can be accompanied by rating the intensity of their choice on a numeric scale. This approach has certain disadvantages such as being cognitively demanding and time consuming. Pictorial scales have been found to be less demanding with respect to time and effort. For example, Desmet et al. [11] found in their studies that “subjects are embarrassed when asked to express their emotional response to products. There are several explanations to this phenomenon. First, emotions are difficult to verbalize, especially the type of subtle, low intensity emotions by products”. In addition, they explain it further stating that “asking users to describe their emotional responses will require cognitive involvement, which may influence the response itself”. Moreover, Vastenburg et al. [30]state, “Most instruments […] rely on verbal self-reports. Such questionnaires and scales tend to be rather demanding for the respondent.”
Emotions can be difficult to verbalize, especially low intensity emotions [10].Asking people to describe their emotions requires cognitive involvement, which could impact the response itself. Therefore, tools that let people express or rate emotions without the use of text can be preferable. The most efficient way of representing emotions is with facial features, because facial cues are used as a main means for judging emotional information even though other sources can provide more accurate information [13,22]. Thus, in this paper we propose a novel assessment tool based on LEGO Minifigures. The goal and main contribution of this paper is the design and evaluation of a new tool that allows us to rate emotions by having people choose a specific Minifigure which best represents their emotional state or reaction.
There are nearly 6000 different Minifigures that have been designed since 1975 [3].Whereas most other pictorial scales are based on a small number of drawings created for a specific purpose (e.g. [10,6,7, 31),our approach was to select suitable facial expressions representingspecific emotions from a large pool of LEGO Minifigures. This overcomes a potential shortcoming of other pictorial scales for which the initial sample of available drawings for each scale point might have been too small.
In the following sections we discuss related work, the development of the pictorial LEGO Minifigure scales, report on two experimental studies that evaluate the validity of the scales, and discuss our findings and future work.
Related Work
Although the perception of emotions has been shown to be culturally independent[14], words can be sensitive to different interpretations across cultures or across individuals from the same culture. Scales relying on written language rather than pictorial content require users to understand the language in order to be able to interpret the words correctly. Many verbal scales are not suitable for use across different cultures.
In addition, verbal scales may pose problems for people who cannot properly read written text, including young children. Age related lower levels of verbal fluency or development related variations in understanding of test questions are important factors to take into account [6]. Also, using numeric rating scales requires respondents to map their own concept of an emotion and its intensity onto another dimension. A judgment has to be made by translating the personal experience to numerical values, or a certain distance between end points represented by the scale.
[31]studied which graphic symbols are perceived by four-year olds as best representation of the four emotions: happy, sad, afraid, and angry. For each emotion they selected four graphic depictions of faces taken from three different sources (Picture Communication Symbols, PICSYMS, and Makaton; see ([31]).They found that happy, the only positive or pleasurable emotion was a relatively easy emotion to represent in a graphic symbol. Angry was more difficult and sad and afraid were found to produce the least consensus in terms of expected responses to these emotions. This suggests that recognizing some emotions (e.g. angry) may be more susceptible to individual influences, as there is a variety of ways that different people in different contexts can express them.
The Self Assessment Manikin (SAM) is a pictorial scale to measure people’s ratings of three independent affective dimensions: pleasure, arousal, and dominance. It is used to measure a person’s affective reaction to situations, stimuli or events[7]. The SAM was developed to overcome issues with verbal scales such as the required time, effort and the need to be able to interpret written language. The scale uses graphical depictions of a Manikin to be rated by people. Each of the three dimensions has five figures representing different intensity levels. The pleasure dimension ranges from a happy to an unhappy figure. The arousal dimension ranges from an excited figure to a relaxed figure, whereas the dominance dimension changes the size of the manikin. Bradley et al.[7] compared people’s responses to a set of 21 pictures (International Affective Picture system) using SAM (3 ratings) or a Semantic Differential (requiring 18 ratings). They found that correlations between the two rating methods were high for pleasure and arousal. Differences in the dominance dimension suggest that SAM may better track a person’s response to an affective stimulus. They argue that SAM may lead to more consistent judgments because the figure is human-like.
Emocards[10] is a method that uses 16 cartoon faces showing eight different emotional expressions (one each for each gender). The expressions are combinations of two dimensions pleasantness and arousal. A pleasant emotion with high levels of arousal for example is euphoric, whereas an unpleasant emotion with high arousal is annoyed. The emotions depicted by the faces in Emocards are the ones most frequently elicited by products. Desmet et al.[10]argues that the method can be used as an aid to objectify emotional responses to a product and as an aid for starting conversation between participants and researchers or designers.
Isomursu et al.[22] presented a comparison of five self-report methods for measuring emotional responses to mobile applications. The comparison included SAM, Emocards, and three self-created tools (Experience Clip, Expressing Experiences and Emotions, and Mobile Feedback Application). They developed a comparison framework and showed that all of these methods can be successfully used for collecting emotional responses, all with certain advantages and disadvantages. SAM results, for example, correlated well with results obtained from other methods, however, they found that the SAM scales were not easy to interpret for participants. For some participants it was not clear whether to evaluate their own state or that of the application. Likewise for dominance, it is not clear whether the participant or application had to be judged. With Emocards some participants complained that they could not find a picture to represent their emotional state.
Pollak et al.[27] presented the Photographic Affect Meter (PAM), which is an affect tool that measures affect on the valence and arousal dimensions. It allows the user to select their mood from a set of pre-defined pictures that are obtained from the Flickr API. Based on several tests Pollak et al. identified the most common user-selected photos, and defined the arrangement of the tool in a 4x4 grid layout. Their results confirmed the validity of the proposed PAM tool.
Scales based on real faces often use actors for expressing the respective emotion. But actors might portray emotions differently and more intensively than non-professionals [18]. However, recent studies by Aviezer et al.[2] suggest that, in real world situations, people cannot distinguish between intense positive and intense negative emotions expressed through facial expressions alone but only in conjunction with body cues. Thus, for scales showing faces only, depicting exaggerated emotions might ensure better discriminability for low as well as highly intense emotions.
Another limitation of scales using photographs or drawings of faces that express emotions is that they can potentially introduce gender bias [10]. Authors can address this by generating both male and female faces, or by using gender natural faces.
We propose a measurement scale based on LEGO Minifigures that can be used by a range of different people; the nature and the wide use of LEGO allow it to be popular amongst both adults and children [32]. With pictorial scales, respondents still need the cognitive ability to match pictures of facial expressions with a specific emotion, but they do not need to be able to count or use numbers in a categorical way [20]. or be able to express actual emotions and intensities in abstract entities (i.e. numbers). The ability to distinguish between facial patterns expressing basic emotions is developed by the age of 4 to 5 years [6]. Pictorial scales using faces are particularly suitable for children and preferred by children because they are concrete measures and easier to use[20] . In addition, the value of the proposed scale is to communicate the user’s response on emotional stimuli and it is not limited to one context. Potential uses in HCI related contexts maybe evaluating emotional responses to new designs of physical artefacts and hardware interface as well as software interfaces.
We base our design onthe well-established theory of Ekman [15] whose work identified six basic emotions. Other tools use a (slightly) different approach (e.g. SAM is based on pleasure, arousal and dominance; PAM measures affect on the valence and arousal dimensions; Emocards is based on pleasantness and arousal), providing arguably different angles on assessment. Thus, the main contribution of this work is the introduction of an orthogonal emotional evaluation scale using LEGO Minifigures that is based on the six expressions of Ekman and five intensities for each emotion. Our intention is to expand the toolbox for researchers interested in emotion assessment with a novel tool. In addition, the value of using LEGO Minifigures is that they are physically available and can introduce another dimension to an evaluation tool. Allowing people to pick a physical figuring that corresponds to an emotion is a unique and novel approach, which we intend to explore this in our ongoing work. In the following sections we describe how we have developed and evaluated two new pictorial scales for assessing emotions based on LEGO Minifigures.
Scale Development
The goal of this research is to develop a new measurement tool for emotions that will allow subjects to easily rate the emotional value of stimuli as well as their own emotional state. To accomplish this, we developed two scales based on the design of LEGO Minifigures. Our scales are based on a sample of 722 facial expressions available through the LEGO Minifigures. These expressions were rated in a previous study that investigated the change of emotional expression of 722 LEGO Minifigures released between 1975 and 2010 [4]. This study discovered that the variety of facial expressions increased considerably since 1989. Not surprisingly the two most frequent expressions were happiness and anger, however, the proportion of happy faces was decreasing over time. To collect this data we used Amazon’s Mechanical Turk (MT)1 for recruiting participants and administering the questionnaire.
The participants were shown one of the 722 LEGO Minifigure pictures at a time and the task was to rate the type and intensity of the expressed emotion from 1-5 (weak-intense). The emotional types to choose from were anger, disgust, fear, happiness, sadness, and surprise[12,15]. For the scale development, 264 adult participants rated on average 82.05 faces each.
In a follow-up study[5], we evaluated the validity of gathered data via MT compared to gathered data via regular questionnaires. A subset of 96 faces was chosen and ratings received through MT, face-to-face questionnaire and online questionnaire respectively were compared. Our findings showed no substantial differences in the responses, suggesting that MT is a viable option for conducting experiments. These results served as a basis for choosing MT as a tool for rating emotion. We note, however, that although these ratings are based on subjective judgments from many people, this does not establish a “ground truth”. This means that we cannot state that a particular face actually depicts a certain emotion, but that it was rated as showing a particular emotion with a certain frequency. However, this is similar to other scales that have been created based on people’s subjective judgments.
Our results are in line with other research that has shown MT to be a viable option for conducting experiments of this type and that the quality of the results obtained were similar to conventional methods at much lower costs [8,17,26].
Based on our previous research we have developed a scale covering the emotions of `Anger’, `Disgust’, `Fear’, `Happiness’, `Sadness’, and `Surprise’ with 5 intensity levels each.
Item Selection
We used a semi automatic algorithm to find the most representative faces for each emotion type and intensity combination. For example, a participant can rate a LEGO Minifigure as `anger’ with intensity 5. At the same time the algorithm tries to maximize discriminability between categories. For example, a face that was frequently rated as “intense anger” but also often as “intense happy” would be a less suitable candidate than a face with similarly high number of “intense anger” ratings but less clear ratings on one or more particular other emotions.
For each LEGO Minifigure, two statistics were determined: the emotion-intensity category (for example, “intense anger”) that is most frequently associated with the face, and the difference between the frequency of that association and the next most frequent association. For example, for the distribution shown in Error: Reference source not found, the highest frequency is 9/30, for happiness-3, and the next highest frequency is 5/30 for happiness-1 and happiness-2, so the two statistics of interest are 9/30 and 9/30-5/30=4/30.
The two statistics are naturally correlated; the more often a face is associated with any particular emotion, the less often is it associated with any other, making the distance to the next most frequently selected emotion greater. A face which is consistently associated with a single emotion-intensity category will have values 30/30=1 and 30/30-0=1 respectively (the largest theoretically possible), whereas a face which has been associated equally with all the 30 emotion-intensity categories will have values 1/30 and 0 respectively (the smallest theoretically possible). For each emotion-intensity category, five candidate Minifigure faces were chosen to represent this category and no other. After that, the best option was selected manually from these candidates. Our choice was guided by two requirements: a face can only appear once in the whole scale and the faces should not be alien (i.e. animal or sci-fi like). Some faces were among the best five options for multiple scale points, in particular for low intensity emotions. A certain face might, for example, be equally suitable for sadness at the intensity level two or three. We selected the most suitable unique face for every scale point. From a design perspective, it is reasonable to give the entire scale a consistent look. Thus, we do not include faces of aliens or that have artefacts such as sunglasses.
|
intensity |
1 |
2 |
3 |
4 |
5 |
|
anger |
2 |
1 |
1 |
2 |
1 |
|
happiness |
5 |
5 |
9 |
1 |
0 |
Table 1 An example distribution of responses for a LEGO Minifigure image.
Stylization
Many LEGO Minifigure faces have certain features that might not be necessary for the communication of emotions, for example, slight shadows on the sides or slight variations in the color of the skin. Moreover, in certain situations it might not be advisable to present colorful faces. Reproducing color consistently across different devices such as screens, printers and projectors remains a difficult task requiring a full color synchronization process and color calibration for each device. To avoid these problems, we developed a stylized version of the LEGO faces that exclude unnecessary details and use gray scale colors. Moreover, transforming the LEGO faces to vector graphics enables users to scale the faces to any desired size without any loss of visual quality. A professional designer used the original LEGO faces as templates to draw stylized faces using a maximum of four gray scale colors: white, light gray, dark gray and black. The stylized faces were created using vectors rather than a bitmap and are therefore easily scalable. The vector graphics can be transformed to bitmap graphics at any desired size. Bitmap graphics are more commonly used in the World Wide Web, such as in the JPEG, PNG or GIF file format.
First Evaluation Study
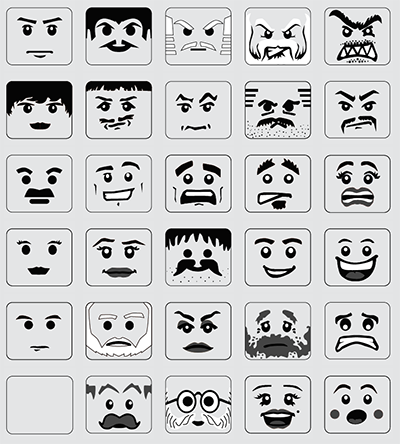
We performed an experiment to evaluate the two new measurement instruments: LEGO Face Scale (LFS) and Stylized LEGO Face Scale (SLFS); examples are shown in Fig. 1(A) and Fig. 1(B) respectively. We investigated the validity of the two new instruments by comparing them to ratings on a 5-point Likert scale (Fig. 1(C)). In this first study we asked participants to rate the emotional expression of face portrait photographs selected from the Japanese Female Facial Expression (JAFFE) Database [25]. The following sections describe the methods and setup of the study.
http://bartneck.de/website/publications/2015/LEGOPictorialScales/CameraReady_INTERACT_OBAIDatel_html_3f01007d.png
|
(a) lego face scale (lfs) |
(b) stylized lego face scale (slfs) |
|
(c) likert scale |
|
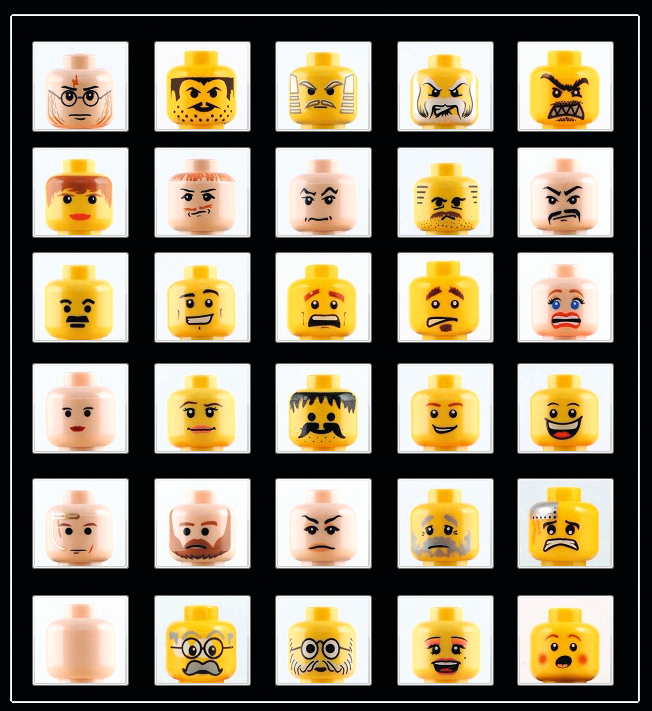
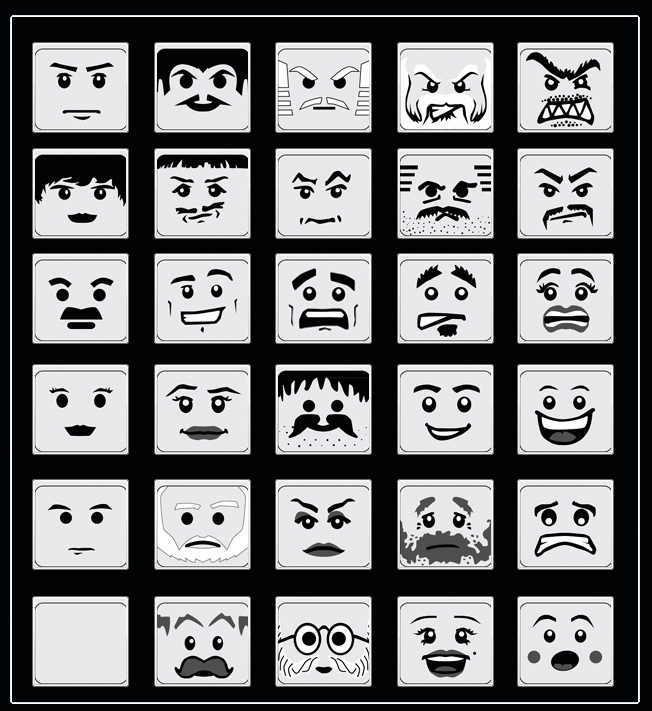
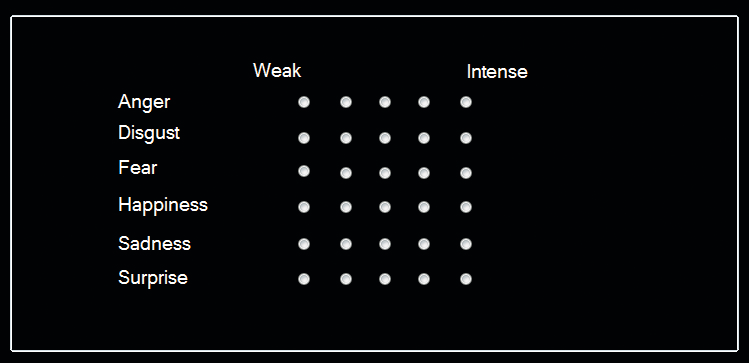
Fig.1. The three measurement scales (A) LEGO Face Scale, (B) Stylized LEGO Face Scale,and (C) A five point Likert scale.
Stimuli
The 213 pictures of the JAFFE Database [25]. were used as the stimuli for our experiment. All the faces were used for each of the three conditions, resulting in (213x50x3) 31.950 responses. In the LFS condition we used the images of the LEGO faces and in the SFLS condition we used the stylized LEGO faces. In the third condition, we used a five point Likert scale. Fig. 1 shows the three scales, where the emotions presented in the scale’s rows of Fig. 1(A) and Fig. 1(B) are (from the top) anger, disgust, fear, happiness, sadness, and surprise.
Method
A between-subject design was used to perform the experiment in which we used three different measurement tools as our three experimental scales: LFS, SFLS and Likert. We used MT to recruit participants and to execute the study. The participants were asked to rate what emotion each stimulus expressed using the measurement tools presented in Fig. 1. The experimenter posted the questionnaires as tasks within the MT environment, where the Mechanical Turk Users (MTU) could then answer as many questions as they desired. Fifty different participants rated each stimulus, where they could stop at any time. This means that it would have not been the exact same 50 participants rating each and every stimulus. This plays an important part in the selection of an appropriate statistical test, as described in the results section.
To protect the privacy of MTUs, we were not allowed access to demographic data; hence it is not available for this study. However, we can be relatively certain that all participants are adults since minors are not allowed as MTUs. Previous surveys on the population of MTUs reveal that MTUs from the US tend to be well educated, young, have moderately high incomes, and are roughly equally male and female [21,28]
Second Evaluation Study
In this study we present standardized stimuli that are intended to induce physiological states that manifest themselves in physical reaction. Participants were asked to rate their reactions using the three measurement tools (LFS, SLFS, and Likert). For this study we directly recruited participants instead of using Amazon’s MT. Section Stimuli describes how the stimuli images were selected and Section Method outlines the method used to evaluate the proposed measurements tools.
Stimuli
In order to induce physical responses we used images from the standardized International Affective Picture System (IAPS) as stimuli [23]. The corpus of 1182 IAPS images comes with a table of ratings collected from a group of 100 college students (50 male, 50 female). These students were asked to rate the images based on the Self-Assessment Manikin (SAM); however, the images do not have an associated label that relates to one of the six basic emotions identified by Paul Ekman: happiness, surprise, fear, sadness, anger, and disgust combined with contempt [12,15].
We reviewed the set of 1182 images and selected 50 that we believed to be the best candidates for eliciting the six emotions. We selected stimuli images with the highest arousal ratings (positive and negative) within their category and further edited the selection based on the content. We chose to limit our subset to 50 images based on the suggested limit in [9], in which 50 images was the approximate average number that participants were willing to evaluate in one sitting.
To verify the use of the 50 stimuli images and to ensure that we would obtain a sufficient variety of responses, we decided to perform a labeling pre-study to evaluate the reaction to the 50 images.We wanted to determine the overall feelings associated with our images as well as the level of intensity related to those feelings. The labeling pre-study involved 24 participants: 15 men and 8 women of ages 22 - 44 years, from eight countries. The labeling pre-study allowed participants to view each of the 50 images for a fixed time and then immediately presented them with an evaluation screen that allowed them to select one of six emotions and a level of intensity related to the emotion selected. The data obtained from this study verified that the 50 selected images consisted of a near equivalent number of positive and negative images with varying levels of impact as shown in Error: Reference source not found.
In a follow-up interview, we asked participants about their overall emotional response to the images. Most stated that they were not overly disturbed or offended by the images shown. No one felt the need to end the study due to discomfort.
label |
number of images (of 50) |
average intensity |
| sad | 13 | 5.12 |
| scared | 6 | 5.95 |
| disgusted | 2 | 6.15 |
| surprised | 5 | 4 |
| happy | 22 | 5 |
| angry | 2 | 7.1 |
27 positive labels; 23 negative labels; overall intensity range: 3-8 |
||
Table 2. Resultsfrom the image labeling pre-study.
Method
We developed a systemto collect participants’ responses on the set of stimuli images using the three different scales shown in Fig. 1. The system displays an image for five seconds; followed by a screen where the participant can identify one of the six emotions that they feel best describes their response to the image. A blank five-second countdown screen was used after each rating screen to prepare participants for the next stimulus image. Error: Reference source not found shows the sequence of events when doing the study.
The study involved 14 participants: nine male and five female of ages from 23 - 35. For each participant, the set of 50 images was randomly divided into three subsets (A, B, and C) as shown in Error: Reference source not found; the number of images in the subsets were 16, 17, and 17 respectively. Each subset was then assigned to one of the three scale types of the study. We counter balanced the scale type-to-subset assignment for participants.
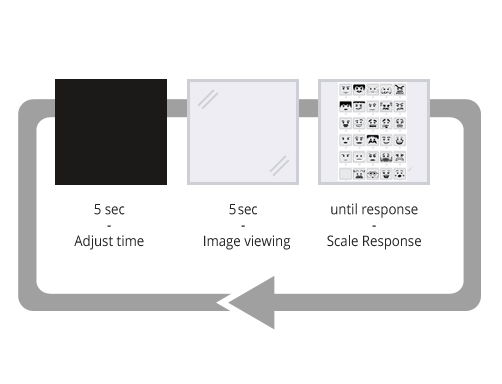
Fig.2 Illustration of the trial sequence: five seconds break (black screen) followed by an image from the pool of 50 IAPS stimuli followed by one of the three scales (Likert, LFS, SLFS).

Fig.3 Illustration of the setup for allocating each of the 50 IAPS into one of three sets and presenting the sets for evaluations using a counterbalanced order for each scale.
Statistical Methods
The emotion, selected by a participant to be associated with a given image, can be modeled as a categorical variable: Anger, Disgust, Fear, Happiness, Sadness and Surprise. Multinomial distribution is the common way to model such outcomes; however, it is difficult to summarize since it is, in effect, a multivariate distribution. In order to assess the consistency of scaling, the entropy statistic was calculated:
where is the proportion of respondents who have categorized the given image to emotion . In our case, entropy equal to 1.79 would correspond to , i.e., a distribution obtained by random chance, and 0 corresponds to the case where all the 50 respondents have selected the same emotion. In order to explore pairwise agreement between scales, a sum of squared differences in proportions was calculated for each image, where is the proportion of respondents who have classified the image to emotion on the scale . This was selected rather than, for example, , which is inapplicable if zero-counts occur in any of the categories.
Mixed-Effects Multinomial Logistic Regression
To test for the effect of the scale on the frequency distribution of the emotions assigned by respondents to each image, a mixed-effects multinomial logistic regression model was fitted. This is a standard choice for nominal response data (e.g. [19]). We have chosen to implement the model within Bayesian framework, using the WinBUGS software [24]. The discussion of Bayesian inference is beyond the scope of this article and an interested reader may refer to, for example [16] for more information; it is, however, becoming more and more widely used due to its flexibility with regard to model formulation and assumptions.
To test if scale matters, the above model was fitted with/without the scale taken into account. The two models were then compared using the Deviance Information Criterion (DIC) [29]. DIC can be viewed as a Bayesian version of the Information Criterion (AIC), which is widely used in classical statistics to compare goodness-of-fit of non-nested models [1]. The smaller the value of DIC, the better the model, and, according to the authors, differences between 5 and 10 are substantial, while differences of more than 10 definitely rule out the model with the higher DIC2. In addition, for the second evaluation study, a Bayesian mixed-effects multinomial logistic regression model was again implemented in WinBUGS (5000 burn-in and 5000 monitored iterations). The model structure accounted for the fact that each participant rated each of the fifty images, as well as for the order in which the images were presented. WinBUGSs was used to implement both models and. convergence was assessed visually.
Results
The distribution of observed entropy by scale and dominant emotion (defined here as the emotion most frequently selected by the respondents for a given image) is shown in Error: Reference source not found. On average, respondents using the Likert scale tended to agree more than those using the other two. However, a large spread should be noted. For some images, the response distribution was not far from that obtained by responding at random. The plot of squared differences in estimated proportions in Fig. 1 shows that the distribution of responses obtained from using LFS and SLFS generally agreed across the emotion range, but both disagreed with the response distribution on the Likert scale.
The estimated multinomial probability distributions of assigning a random image to one of the six emotions under each scale in the evaluation studies one and two are shown in Error: Reference source not found and Error: Reference source not found respectively. These are adjusted for random and a pooled distribution is shown in each case as well. One can see a significant difference in the
|
scales |
study 1:Δdic |
study 2:Δdic |
|
lfs and slfs |
-580.28 |
-5.42 |
|
lfs and likert |
1628.03 |
-92.29 |
|
slfs and likert |
1102.98 |
-49.11 |
|
all |
1315.00 |
-79.85 |
Table 3. DIC comparisons between the scale-specific and pooled models in studies 1 and 2. Large negative values indicate that the pooled model is better, i.e. no effect of scale on probabilities of assigning a photograph to an emotion-intensity categories. ‘All’ corresponds to testing the hypothesis of at least one of the scales being different from the rest.
|
|
dic, with ord. |
dic, without ord. |
Δdic |
|
style specific |
1843.74 |
1849.09 |
-5.35 |
|
pooled |
1763.52 |
1765.75 |
-2.23 |
Table 4. DIC comparisons between the models where order is taken into account and where it is not for the second evaluation data. Smaller DIC indicate a better model. There is therefore some evidence that order does have an effect on the assessment. Also, the pooled model has significantly smaller DIC values whether the ordering is taken into account or not, demonstrating lack of statistical evidence for the scale effect.
proportion of the images marked as `angry’ between the three scales, increasing from LFS to SLFS to Likert, with the opposite trend in disgust’.
For the second study, about 35% of the images appear to have been assigned to the happy’-category with the rest of the probability mass being almost equally distributed between the other five emotions. The DIC values expressing the possible scale-specific effects in evaluation studies one and two are shown in Table 1. In each case the model with scale-specific probabilities of emotion selection was compared to the model where scales were assumed to have identical probability distributions. A negative DIC means that the pooled model was better than the scale-specific one and thus that no statistical evidence for the effect of scale has been found. The results for evaluation study one show that while for LFS and SLFS the distribution of responses, adjusted for random image-specific effects, is the same, there are significant pairwise differences between LFS and Likert as well as between SLFS and Likert scales. These differences are large enough to justify the scale-specific rather than pooled model overall (DIC=1315.00). For the second study, however, the pooled model was always found to be statistically better since the DIC was found to be always smaller for the pooled model (see Table 1). For the second evaluation study, the possible effect of the order in which the images were presented was also tested and the results are presented in Table 1. The smallest DIC is returned for the pooled model adjusted for order (DIC=1763.52). The difference with the DIC of the pooled model not adjusted for order, however, is small DIC=2.23) indicating only slight possible effect.
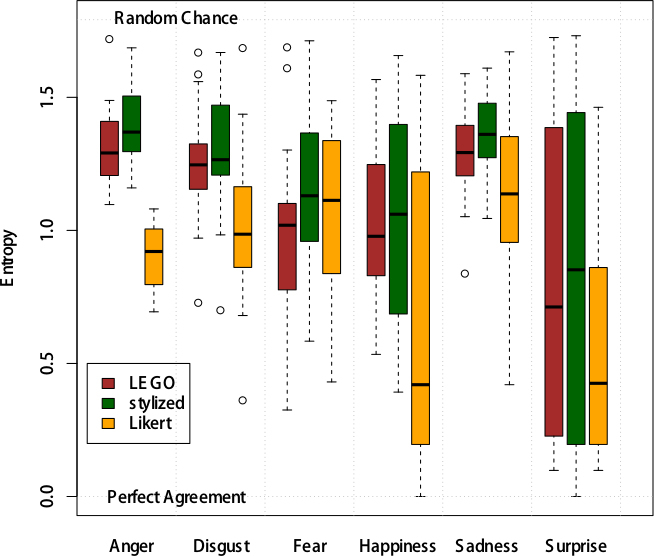
Fig. 4. Entropy by Scale and Mode Emotion.
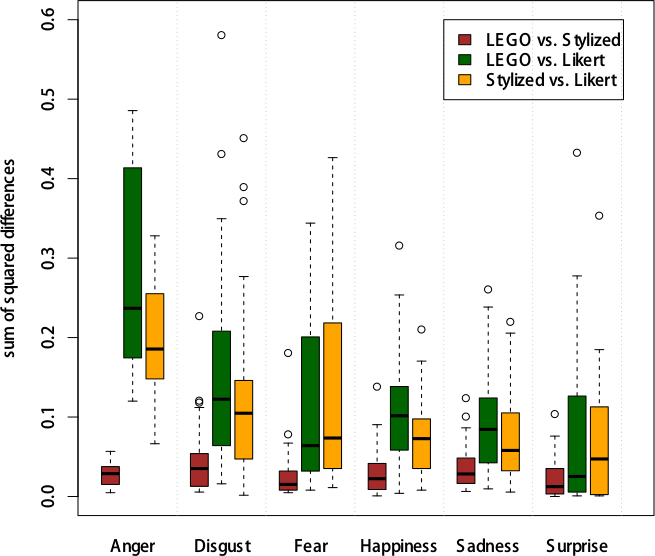
Fig. 5. Disagreement by Scale and Mode Emotion.
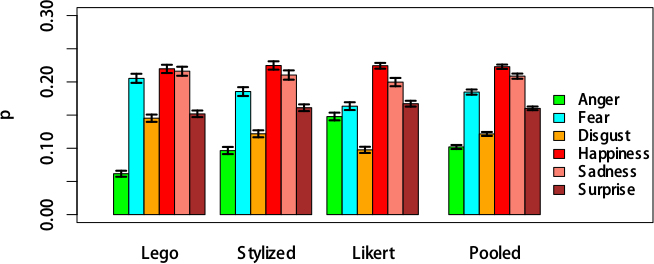
Fig. 6. For the first evaluation, the graphs represent the estimated posterior mean probabilities and the associated 95% CIs (credible intervals) of categorizing a random photograph into each of the six emotions by scale, and pooled.

Fig. 7. For the second evaluation, the graph represents the estimated posterior mean probabilities and the associated 95% CIs of categorizing a random image into each of the six emotions by scale, and pooled.Model adjusted for individual- and order- random effects.
Discussion
We have conducted two studies to evaluate the proposed pictorial scales. First we compared the two pictorial scales to a Likert scale when judging emotions of others. The task was to judge images with facial expressions of different emotions with the three scales. This study was conducted using the Amazon Mechanical Turk service, which allowed us to gather a large amount of data for our evaluation purposes.
As a measure of reliability we calculated entropy, where the smaller the entropy, the better the respondents agree in their ratings of an emotion that a specific image depicts. This indicates that the respondents on average agree more when using the Likert scale than when using the pictorial scales.Happiness shows most agreement, however, the variation of the entropy measure for the different pictures that were rated as happy is rather large from almost perfect agreement to almost random ratings.
When comparing ratings of facial expressions between the three rating scales, our findings indicate that the judgments of facial expressions tend to agree between the two pictorial scales. On the other hand, the Likert scale ratings are likely to differ; this means that emotion might be rated differently with the Likert scale. Moreover, it indicates a lack of construct validity of the pictorial scales as measured against Likert-scale ratings. It should be noted that the Likert scale, although it is frequently used as a rating scale, it is not a baseline for rating emotions in a strict sense. Therefore, the finding that the ratings differ does not mean that the LFS and the SLFS scales are less suitable for rating emotional expressions. At this stage we cannot judge which of the three approaches generated more ‘correct’ emotional ratings.
One concern could be that, when rating the emotional expression of faces with pictorial scales, users might simply match the facial expression in the stimulus with an image in the scale that visually provides the best match. In principle, this visual matching could be done without actually judging the emotional expression. One then might argue that it is not necessary to actually judge the shown emotion. But this does not necessarily rule out the usefulness of such a pictorial scale. It could still give meaningful results when seen from the perspective that it allows users to just pick a face without having to go through an active cognitive interpretation process which for example requires verbalization of the otherwise just visually processed emotion. Brasley et al.[7] argue that the scale SAM may lead to more consistent judgments than a verbal scale (Semantic differential) because the stimulus material is human-like.
The translation of personal experience to numerical values, such as in Likert scales, can be somewhat problematic. While some might assume that the numbers represent equidistant categories for judging emotional intensity (e.g. the difference between level 1 and 2 is the same as between 2 and 3), others might interpret the same scale as ordinal (where the difference between levels is not necessarily the same). This must be taken into account in analyzing data from such scales. Equal intervals in a scale can ensure a higher level of discriminability in a sense that the categories are more or less distinct and do not measure the same quantity [6]. When designing our pictorial scales we developed a selection algorithm that was designed to find the best representative for each emotion and intensity level, while still aiming to achieve a high amount of discriminability. However, we cannot assume equidistance between the intensity levels. This should be taken into account by analyzing and interpreting data obtained with these scales.
In the second study, we took a slightly different approach compared to the first one. Instead of using pictures and having users judging these facial expressions, we used a set of images that were supposed to elicit an emotional reaction. The task was then to use one of the three methods to rate this emotional reaction. Therefore, instead of rating emotional facial expressions, the users’ emotional state is of interest here. Furthermore, the above mentioned facial image matching could not take place because the stimulus material was more generic; not necessarily showing people’s faces. Results of this experiment show that ratings made with all scales agree. This means that the two pictorial scales and the Likert scale produce very similar ratings for judging a user’s emotional state elicited through pictorial stimulus material.
It would be desirable to first establish a ground truth to compare the ratings against. Taking our findings into account one might even argue that Likert scale based ratings, the most commonly used approach, might be less suitable for certain types of emotional rating as they require more cognitive effort. Therefore, trying to validate new methods with comparing them to Likert scale based ratings might not be the best approach. Thus, further studies are needed to investigate the scales’ validity.
Our findings thus indicate that when judging emotion of faces, judgments based on the two pictorial scales that we have developed can in some instances be different from Likert scale based ratings. However, when rating one’s own emotional state or reaction to a scene, there is no difference between these measures. Further investigations are needed to study these findings in more detail and to see, why the pictorial scales differ in the one instance but not in the other. One possible explanation for this could be found in the notion of pictorial matching. We could assume that having to interpret someone else’s facial expression and having to verbalize this (i.e. finding the verbal expression that corresponds to the facial expression) requires more cognitive demand [11] and thus might introduce some bias in the emotion rating process. Using pictorial scales could be easier and quicker for completing the same task. When this easy matching process cannot be done (for example, when rating one’s emotional response to a scene) there always has to be some interpretative step, which could explain why the three methods achieved more similar results in the second experiment.
Finally, the LEGOMinifigures are not only useful as a measuring tool, but there are other valuable uses. Similar to Desmet et al.[10] the Minifigures can be used as an aid to objectify emotional states and responses, which could be difficult for many people to express otherwise. Also, the Minifigures can be used to start a conversation on these responses between participant and researcher or designer.
Conclusion and Future Work
We describe the design and the evaluation a new measurement tool for rating emotions based on LEGO Minifigures. The measuring tool use Minifigures selected by responders to represent a respective emotion and intensity. As one step towards this tool, we chose to create two pictorial scales based on Minifigure images (LEGO Face scale and Stylized LEGO Face scale). The scales are based on images from a pool that consists of more than 700 Minifiguring faces. This allowed us to choose suitable facial expressions for the respective emotions and their intensities from a large amount of possible faces. This approach could overcome problems found by other researchers with tools based on a smaller selection of stimuli or designed stimuli.
Moreover, based on the results of our study we assembled a physical version of our facial scale (see Error: Reference source not found). This version is now ready for further testing and we refer to it as the Emotion Rating Figurines (ERF). The ERF may enable people to indicate emotions by selecting an emotional figurine from our set of calibrated figurines. ERF may enable children to easily express their emotions, since they typically identify themselves with dolls during play already. Also other users who struggle with processing abstract categories of emotions could greatly benefit from this new measurement tool.
The ERF has a large potential for mental and other health assessments. An increasing number of children suffer from communication disorders, attention deficit hyperactivity disorder, Aspergers syndrome and autism. The ERF could enable them to communicate emotions even if their specific disorder impairs them from using language-based tools. Due to the potential toy-like design of the ERF, children may naturally be attracted to it. The great advantage of ERF over existing questionnaire based emotion measurement tools is the physical embodiment of the figurines.
In general, users couldbe more easily able to project themselves into the figurines compared to identifying themselves with a drawing on paper. The ERF might become useful for HCI researchers, psychologist, therapists, social workers and others who want to better communicate with their clients about emotions.

Fig. 8 A physicalLEGO Face Scale named Emotion Rating Figurines (ERF).
References
- Akaike, H. Information Theory and an Extension of the Maximum Likelihood Principle. In the second InternationalSymposium on Information Theory, 267–281 (1973).
- Aviezer, H., Trope, Y., and Todorov, A. Body Cues, Not Facial Expressions, Discriminate between Intense Positive and Negative Emotions. Science, 338(6111):1225–1229 (2012).
- Bartneck, C. The Unofficial LEGO Minifigure Catalog.CreateSpace, Charleston (2011).
- Bartneck, C., Obaid, M., and Zawieska, K. 2013. Agents with Faces - What can we Learn from LEGO Minfigures. In Proceedings of the 1st International Conference on Human-Agent Interaction. Hokkaido University (Japan), Sapporo, Japan, PP. III-2-1 (2013).
- Bartneck, C., Duenser, A., Moltchanova, E., and Zawieska, K. (In Press) Comparing the Similarity of Responses Received from Studies in Amazon’s Mechanical Turk to Studies Conducted Online and with Direct Recruitment. PLOS ONE (2015).
- Bieri, D., Reeve, R., Champion, G., Addicoat, L., and Ziegler, J. The Faces Pain Scale for the Self-Assessment of the Severity of Pain Experienced by Children: Development, Initial Validation, and Preliminary Investigation for Ratio Scale Properties. Pain, 41(2):139–50, (1990).
- Bradley, M.M., and Lang, P.J. Measuring Emotion: The Self-Assessment Manikin and the Semantic Differential. Journal of Behavior Therapy and Experimental Psychiatry, 25(1):49–59(1994).
- Buhrmester, M., Kwang, T., and Gosling, S. Amazon’s Mechanical Turk: A New Source of Inexpensive, yet High-Quality Data? Perspectives on Psychological Science, 6(1) 3-5, (2011).
- Cummings, D. Multimodal Interaction for Enhancing Team Coordination on the Battlefield. Texas A&M University, College Station, TX, USA, Dissertation (2013).
- Desmet, P., Overbeeke, K., and Tax, S. Designing Products with Added Emotional Value: Development and Application of an Approach for Research Through Design. Design Journal, 4(1):32–47 (2001).
- Desmet, P., Vastenburg, M., Van Bel, D., and Romero, N. Pick-a-Mood; Development and Application of a Pictorial Mood-Reporting Instrument. In Proceedings of the 8th International Design and Emotion Conference, 11–14 (2012).
- Ekman, P. An Argument for Basic Emotions. Cognition and Emotion 6(3):169-200 (1992).
- Ekman, P., and Friesen, W. The Repertoire of Nonverbal Behavior: Categories, Origins, Usage and Coding. Semiotica, 1(1):49–98 (1969).
- Ekman, P., and Friesen, W. Constants Across Cultures in the Face and Emotion. Personality and Social Psychology, 17(2):124–129 (1971).
- Ekman, P., and Friesen, W. Unmasking the Face. Prentice Hall, Englewood Cliffs (1975).
- Gelman, A., Carlin, J., Stern, H., and Rubin, D. Bayesian Data Analysis. Chapman and Hall/CRC (2004).
- Goodman, J.K., Cryder, C.E., and Cheema, A. Data Collection in a Flat World: Accelerating Consumer Behavior Research by using Mechanical Turk. Journal of Behavioral Decision Making (2012).
- Grimm, M., and Kroschel, K. Evaluation of Natural Emotions Using Self Assessment Manikins. Automatic Speech Recognition and Understanding, IEEE Workshop, 381–385 (2005).
- Hedeker, D. A Mixed-Effects Multinomial Logistic Regression Model. Statistics in Medicine, 22:1433–1446 (2003).
- Hicks, C.L., Baeyer, C.L.v., Spafford, P.A, Korlaar, I.v., and Goodenough, B. The Faces Pain Scale - Revised: Toward a Common Metric in Pediatric Pain Measurement. Pain, 93(2):173–183 (2001).
- Ipeirotis, P.G.. Demographics of Mechanical Turk. Technical report, New York University, (2010).
- Isomursu, M., Ta¨hti, M., Va¨ina¨mo¨, S., and Kuutti, K. Experimental Evaluation of Five Methods for Collecting Emotions in Field Settings with Mobile Applications. International Journal of Human-Computer Studies, 65(4):404–418 (2007).
- Lang, P.J., Bradley, M.M. and Cuthbert, B.N. International Affective Picture System (IAPS): Technical Manual and Affective Ratings (1999).
- Lunn, D., Thomas, A., Best, N., and Spiegelhalter, D. WinBUGS – A Bayesian Modeling Framework: Concepts, Structure, and Extensibility. Statistics and Computing, 10:325–337 (2000).
- Lyons, M.J., Akamatsu, S., Kamachi, M., and Gyoba, J. Coding Facial Expressions with Gabor Wavelets. In third IEEE International Conference on Automatic Face and Gesture Recognition, 200–205. IEEE (1998).
- Paolacci, G., Chandler, J., and Ipeirotis, P. Running Experiments on Amazon Mechanical Turk. Judgment and Decision Making, 5(5):411–419 (2010).
- Pollak, J.P., Adams, P., and Gay, G. Pam: A Photographic Affect Meter For Frequent, In Situ Measurement of Affect. In Proceedings of the SIGCHI Conference on Human Factors in Computing Systems, 725–734, ACM (2011).
- Ross, J., Irani, L., Silberman, S., Zaldivar, A., and Tomlinson, B. Who are The Crowdworkers? Shifting Demographics in Mechanical Turk. In Proceedings of the SIGCHI Conference on Human Factors in Computing Systems, 2863–2872, ACM (2010).
- Spiegelhalter, D., Best, N., Carlin, B., and Van der Linde, A. Journal of the Royal Statistical Society, Series B, 64(4):583 (2002).
- Vastenburg, M., Romero Herrera, N., Van Bel, D., and Desmet, P. Pmri: Development of a Pictorial Mood Reporting Instrument. In Proceedings of the SIGCHI Conference on Human Factors in Computing Systems, 2155–2160, ACM (2011).
- Visser, N., Alant, E., and Harty, M. Which Graphic Symbols Do 4-Year-Old Children Choose to Represent Each of the Four Basic Emotions? Augmentative and Alternative Communication, 24(4):302–12 (2008).
- The LEGO Group, A Short Presentation (2011).
Footnotes
1 MT is a crowd-sourcing web service that enables distributing small tasks to a large anonymous workforce who receive micro-payments for completed tasks.
2 http://www.mrc-bsu.cam.ac.uk/software/bugs/the-bugs-project-dic/#q9
This is a pre-print version | last updated February 16, 2016All Publications