DOI: 10.1145/1734454.1734473 | CITEULIKE: 6775798 | REFERENCE: BibTex, Endnote, RefMan | PDF ![]()
Saerbeck, M., & Bartneck, C. (2010). Attribution of affect to robot motion. Proceedings of the 5th ACM/IEEE International Conference on Human-Robot Interaction (HRI2010), Osaka pp. 53-60.
Perception of Affect Elicited by Robot Motion
Philips Research
High Tech Campus
Eindhoven, The Netherlands
martin.saerbeck@philips.com
Department of Industrial Design
Eindhoven University of Technology
Den Dolech 2, 5600MB Eindhoven, NL
christoph@bartneck.de
Abstract - Nonverbal behaviors serve as a rich source of information in inter human communication. In particular, motion cues can reveal details on a person’s current physical and mental state. Research has shown, that people do not only interpret motion cues of humans in these terms, but also the motion of animals and inanimate devices such as robots. In order to successfully integrate mobile robots in domestic environments, designers have therefore to take into account how the device will be perceived by the user. In this study we analyzed the relationship between motion characteristics of a robot and perceived affect. Based on a literature study we selected two motion characteristics, namely acceleration and curvature, which appear to be most influential for how motion is perceived. We systematically varied these motion parameters and recorded participants interpretations in terms of affective content. Our results suggest a strong relation between motion parameters and attribution of affect, while the type of embodiment had no effect. Furthermore, we found that the level of acceleration can be used to predict perceived arousal and that valence information is at least partly encoded in an interaction between acceleration and curvature. These findings are important for the design of behaviors for future autonomous household robots.
Keywords: Expressive robotic behavior, nonverbal communication, affective communication
Introduction
The development of autonomous household robots raises new design issues. Multiple studies have stressed the impact of a robotic device on the social life [31, 10, 30]. These results also suggest that the success of a robotic platform depends on more than the mere task performance. For example, a robot that is optimized for speed and cleaning performance with rapid movements can easily perceived as aggressive or nervous. In order to successfully integrate robots in close social proximity of our every day life, we have to understand how these machines and their behaviors are perceived and interpreted by their users.
In this study we focus on the problem of designing expressive behavior for robots, in particular on designing expressive movements. Non-verbal communication through gestures plays an important role for human communication. For example Heider and Simmel have demonstrated already in 1944 that people are naturally biased to interpret motion patterns in terms of social or emotional terms [13].
Designing expressive movements for robots aims at using motion as modality to convey information, e.g., about the status, and to improve the overall perception of the device. It has been shown that already subtle differences in the movement trajectories can a have a significant effect on how the robot is perceived [23, 24]. For designing expressive and communicative behaviors it is important to know which features cause the interpretation of intentions and emotions [11].
Up to now, the focus of research has mainly been on identifying the motion features that cause the attribution of animacy [29, 3]. In this study we investigate the relation between motion features and perceived emotion, i.e., the emotion that people attribute to the motion pattern when observing a robot. In particular, we derive from literature two motion features, namely acceleration and curvature, which appear to be relevant for the perception of emotion and vary them systematically. The hypothesis is that varying these motion features has also an effect of the perceived emotion. In particular, we systematically analyze this relationship by constructing three levels for both, curvature and acceleration. Furthermore, we compare two different embodiments with different physical setups.
In the following, we first introduce the emotional model and affect assessment tools that have been adopted for this study, before we later discuss the implementation of the motion characteristics.
Perception of emotion
Several models have been developed for explaining the ability of people to perceive emotions based on observations. An evolutionary model suggests that the ability has evolved because it has been an advantage to correctly recognize the intentions of a potential predator. For example Blythe et al. give the example of observing a mountain lion, i.e., judging if the lion is aggressive and searching for prey, mating or relaxed wandering [3].
Another model for interpretation of motion patterns is that social reasoning helps to make sense of an observation. If objects change direction without an obvious reason, people tend to use their social reasoning to explain the phenomenon, i.e., by internal drives and needs including emotional states [16].
Emotional model
A number of different psychological models for the cognitive structure of emotions have been proposed. An extensive discussions on emotional models and the experience of emotions can be found in [20, 1, 6]. In general, two models have found wide acceptance and are supported by empirical evidence.
The first describes emotions as a combination of basic emotions. Ekman found that facial expressions for the six emotions of anger, surprise, disgust, happy, sad and fear are universally recognized [9]. Each of these basic emotions describes an unipolar dimension containing the activation of a particular basic emotion. However, it is not clear which emotions make the basic set of which all other emotions can be constructed [14].
The second model represents experiences of emotions as points in a continuous two dimensional space. Russell found that most of the variance of emotional perception can be accounted for in a two dimensional space with the axis of arousal and valance. This model is referred to as circumplex model of affect [26]. The results of Russell have been repeated in several other studies that found the same axis or rotational variants and resulted in the development of multiple scales to measure different degrees of affect in this two dimensional space [7, 22]. Some studies have extended the model, for example by a third dimension representing dominance[17].
Assessing affect
For our research, we adopted a similar approach as Pollick et al. [25] and Lee et al. [19] and measured emotion according to a two dimensional parameterized model of emotion. Pollick et al. found that emotions perceived from arm motion can be clustered in a space with the two main axis of valence and arousal similar to Russell’s circumplex model of affect [25]. We also followed Pollick’s argumentation that similar measurements can be used both for measuring one’s own experiences of emotion as well as assessing the emotional state of someone else. An overview of assessment methods for affect can be found in [14].
We selected the PANAS [33] and the “Self assessment manikins” (SAM) [17, 4] scales to fit best our needs. First of all, plenty of studies have been reported using the PANAS and the results showed high validity and reliability (Cronbach’s α = 0.89) for a general population [7]. The scale and rating instructions are freely available and are quick to administer. Furthermore, the PANAS has also been administered to rate the affective state of other persons, not only to assess the emotional experiences of oneself. For example, it has been successfully administered to mothers to assess affect of their children [8]. The PANAS scale measures a dimensional model of emotions, which allows to parameterize an emotional state by a coordinate in a two dimensional space. It measures positive affect and negative affect which consist of 10 items for every of the two constructs (see Fig 1).
The SAM scale assesses three independent dimensions pleasure, arousal and dominance (PAD) [21]. Both the PANAS and the PAD models are rotational variants in the same two dimensional space [18]. The advantage of the SAM scale is that it is fast to administer and are not subject to language misinterpretations [4]. We expected that an iconic representation of emotions might be easier to understand and apply to inanimate beings such as a robot. However, to the authors knowledge, the SAM have not generally been administered to assess affective states of others. For our case this is essential, because we are interested in what affective state participants perceive in the robot motion.
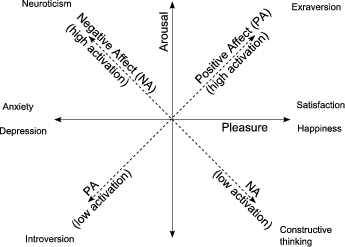
Fig. 1: Simplified version of a two dimensional space of affect (derived from Larsen and Diener [18])
Selection of motion features
In literature, several studies have been published that analyze the perception of particular motion characteristics. In order to determine which motion features are most influential for the perception of emotion, we analyzed the main effects of several studies that investigated the perception of motion. For example, Tremoulet and Feldman have shown that already two cues are enough to give an impression of animacy: 1) change in speed and 2) change in direction [32]. In the following we give an overview of the field.
Camurri et al. aimed to automate the recognition of emotional content of expressive gestures made by dance performances [5]. They asked actors to perform a dance with four different emotional expressions: anger, fear, grief and joy and computed motion features derived from Laban Movement Analysis: overall duration, contraction index, quantity of motion, and motion fluency. They found main effects for example for duration and quantity of motion which are related to changes in speed and trajectory.
Similarly, Gaur et al. aimed at automating the recognition of animate and inanimate characteristics solely based on motion features [11]. They analyzed motion features, including mean distance, mean rotation, range of distance, range of rotation, variance of distance, variance of rotation, spline coefficients representing the sharpness, and an energy metric that calculates the energy that the objects gains to give the impression of being animated. They found that a combination of spline coefficients, change in velocity and direction together with the energy feature hold the most information for classifying a motion as either animate or inanimate. The absolute values seemed to be of less importance.
Bethel and Murphy reviewed different methods for affective expressions, among others using motion [2]. They found that depression is connected with slow and hesitating movements while elation is connected to fast expansive motions.
Blythe et al. analyzed motion patterns for basic behavior patterns of pursue, evade, fight, court, be courted and play [3]. An interesting result was that participants were even able to judge the behavior when the target of the motion was taken away. These results stress that the informational content of motion is independent from the context. Furthermore, they analyzing the relevance of motion features for classification in terms of behavior and found the following order of importance of the features: (1) absolute velocity, (2) relative angle, (3) relative velocity, (4) relative heading, (5) relative vorticity, (6) absolute vorticity and (7) relative distance.
Pollick et al. calculated from a point light display of human body motion [25] the following movement features: (1) wrist kinematics (2) average velocity, (3) peak velocity, (4) peak acceleration, (5) peak deceleration and (6) jerk index. They found that kinematic features correlated with the activation dimension of arousal and valance. Energetic motions were positively correlated with shorter duration, acceleration, jerk, greater magnitudes of average velocity, and peak velocity.
Lee et al. presented a relational framework between motion features and emotions [19] for which they used a two dimensional emotional model with the axis of valance and arousal. They varied the degree smoothness, speed and openness and found a positive correlation between velocity and activation axis and a positive correlation between pleasantness and smoothness, but they could not find an effect for openness.
From the above results it appears that especially relative motion features hold important information for categorizing a motion trajectory. In all studies changes of speed and changes of direction had an effect, while the absolute values seemed to be of less importance. Only the study of Blythe et al. found absolute velocity to carry most information, but they also found that the absolute ordering of the features was of less importance. The study of Gaur et al. found the absolute values explicitly of less importance [11]. Based on these results we chose to focus our study on the motion parameters of acceleration (representing differences in speed) and curvature (representing differences in direction).
Furthermore, we expect these parameters to influence how the motion is perceived in emotional terms. High energy motions that often change direction or velocity should be interpreted as more active. However, the existing studies remain inconclusive how these parameters influence the valence dimension. Some studies reported that the smoothness has an effect on the valence, but the type of the relationship remains unclear.
In the following, we describe our experimental setup in which we systematically vary the two motion parameters acceleration and curvature in the behavior of a robotic embodiment.
Measuring perception of motion
In order to display a robotic motion characteristic, the movements need to be implemented on a robotic embodiment. The concrete display of a motion feature naturally also depends on the concrete embodiment.
Depending on the physical setup of a robotic embodiment, two different types of motion are possible, that we refer to as external motion and internal motion. With external motion we refer to motion ‘external’ to the embodiment, i.e., movement of an object itself a defined space. With internal motion we refer to posture changes internal to the embodiment, i.e., movement of the limbs.
Based on these observations, we chose for our study two embodiments with two different types of motion, namely the iCat robot for implementing the internal motion and the Roomba robot for implementing the external motion. These two platforms are introduced in the following.
Robotic embodiments
The iCat robot is a robotic research platform developed by Philips Research for human machine interactions. The robot is depicted in Fig. 3. The iCat robot has the shape of a cat and is approximately 40cm tall. It has an animated mechanical face with 13 degrees of freedom to express basic emotions, such as happiness, sadness or disgust. For our experiment we focused on the pan and tilt of the head. The expression of the face was kept neutral in order to avoid an interpretation of iCat based on the symbolic expression of the face rather than the impression of the movement patterns.
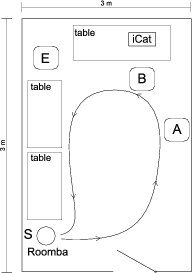
Fig. 2: Experimental setup of the room indicating the movement of Roomba, starting from position S. In the Roomba condition participants were placed in position A and in the iCat condition in position B. The experimenter was placed at position E.
The Roomba robot is a commercially available vacuum cleaning robot developed by iRobot. The robot is depicted in Fig. 4. Roomba has a circular shape with a radius of approximately 15cm. It has a differential drive system, consisting of two velocity controlled wheels that can be controlled via a serial interface. We tested and evaluated the drive accuracy of the robot as described in [27].
Even though both embodiments are very different from each other, both have demonstrated their ability to elicit emotions [10, 12]. People are able to recognize motion features of very abstract shapes [13].
Motion pattern generation
For generating the motion patterns, we used graphical animation tools as described in [28]. They generate animations, which is a sequence of actions that can be executed by the robot. These tools furthermore allow to parameterize a motion trajectory and systematically vary the behavior of the robots.
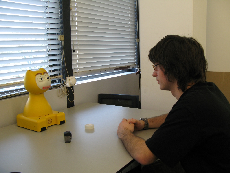
Fig. 3: Sample interaction in the iCat condition.
Three different values for curvature and acceleration were created for both embodiments, resulting in 9 movements for every embodiment. Both robots were assigned a simple task. For Roomba, we defined a circular trajectory through the room as depicted in Fig. 2 so that the robot would start from a defined home position S, drives through the room on the indicated trajectory and returns to the home position afterwards. On this route, Roomba passes the participant at position A. An example picture with Roomba is depicted in Fig. 4.
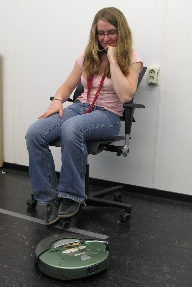
Fig. 4: Sample interaction in the Roomba condition.
In the iCat condition we placed two objects in front of iCat and defined an animation to look at both objects. The robot started from a central position, looked first at the left object then at the right object and finally returned to a central position. The participants were seated with an approximate distance of 80 cm to iCat, in Fig. 2 marked as position B. A sample picture from the iCat condition is shown in Fig. 3.
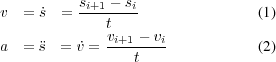
We calculated the values for acceleration and curvature separately for both embodiments as follows. We first approximated the first and second derivatives based on the motion trajectories from the editors. In the current version, the iCat robot updates the motor positions 10 times per second. Therefore, the velocity v of an actuator can be approximated by the difference in position of two consecutive frames and in an analogous manner the acceleration a can be approximated as the difference of two consecutive velocities:
For an animation the average acceleration  was calculated over
the number of frames F as:
was calculated over
the number of frames F as:

|
(3) |
In the same manner also the average velocity of the Roomba robot was calculated, but with the difference that the velocity did not have to be approximated because the serial interface directly accepts a target velocity as a parameter, which was used for the calculation.
As a measurement for curvature we calculated the extrinsic curvature κ. If the radius is known, the curvature can directly be calculated by:

|
(4) |
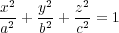
For the Roomba robot we could directly apply this definition, because it always moves in circular segments. In order to calculate the curvature of the movements of iCat, we analyzed the path in space of the center of iCat’s face as it moved the head to accomplish the task. The center is given by the tip of the nose and moves on an ellipsoid surface, which is defined by the radius for the pan and tilt axes. The shape of the ellipsoid is parameterized by the equatorial radii a, b and c along the axes of the coordinate system
|
(5) |
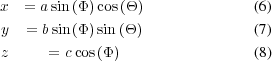
The parameters are given by the iCat embodiment as a = b = 10.5cm and c = 12.5cm, assuming that z is the vertical axis and the x-y plane is parallel to the table. The control signal of the motors can be directly converted to viewing angles. The pan angle Φ is controlled by the value that is sent to the actuator labeled “body” and the tilt angle Θ is controlled by the actuator labeled “neck”. The maximum viewing angles for Φ and Θ are inthe range of -45 ≤ Φ ≤ 45 and -25 ≤ Θ ≤ 25, respectively. With these parameters the three dimensional path is parameterized by
The curvature of a parameterized curve in a three dimensional space is given by:
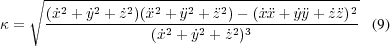
The values for the curvature and acceleration are summarized in Table I.
TABLE I: Values of acceleration and curvature for the three levels low, medium and high.
| Robot | mean acceleration | mean curvature | ||||
|---|---|---|---|---|---|---|
| Condition | low | medium | high | low | medium | high |
| iCat | 0.33 | 0.81 | 1.19 | 0.46 | 0.56 | 1.41 |
| Roomba | 0.18 | 0.60 | 1.10 | 0.85 | 1.50 | 2.20 |
Participants
We recruited participants through the J. F. Schouten School participant database [15]. The database contains people of all age groups who are interested to participate in scientific research experiments. Healthy adult participants, aged 20-45 years, were randomly selected and recruited from this database. All participants were reimbursed for their participation in the experiment. In total, we collected collected complete data from 18 participants, 10 male and 8 female for our analysis.
Procedure
The experiment took approximately 45 min and consisted of
three parts: (1) Intake ( min), (2) Rating of conditions (
 5
min) and (3) Final interview (
5
min) and (3) Final interview ( min). A session started with a
short introduction after which the participants were given an
informed consent form to sign before they observed the
robots.
min). A session started with a
short introduction after which the participants were given an
informed consent form to sign before they observed the
robots.
In total 18 conditions were shown to the participants. We followed a repeated measure design with three independent variables: acceleration (three levels), curvature (three levels) and embodiment (two levels). This setup resulted in 3x3x2 independent variables and 5 measures of emotions as dependent variables, i.e., two from the PANAS (positive affect and negative affect) and three from the SAM (arousal, valance and dominance).
The participants were randomly assigned to see either the iCat or the Roomba embodiment first. Every robot performed nine animations, one for every combination of acceleration and curvature for the values of low, medium and high, respectively. The order of the nine animations was randomized. After every behavior the participants filled in the PANAS and SAM questionnaires. Most of the participants gave spontaneous comments in a think-out-loud fashion, which were also noted down. After the completion of all conditions, a semi-structured interview was performed in which the participants were asked: 1) to give their general impressions on the behaviors, 2) to describe the differences and similarities of the behaviors, 3) to indicate a preference for behaviors and to elaborate why and 4) to compare the observed behaviors with behaviors they would expect from a commercial product. At last the participants received a small reimbursement according to the guidelines of the J.F. Shouten participant database.
Results
Gender effects
First of all, we tested whether gender had an effect. We performed an analysis of variance with the sex as independent variable and tested if there is a significant effect on any combination of acceleration and curvature for the Roomba and the iCat condition. All combinations summed up to a total of 90 measurements (three levels for acceleration, three levels for curvature, two levels for embodiment and five measurements for valence, arousal, dominance, positive affect and negative effect). Neither significant main effects nor significant interactions were found for gender. Hence gender could be excluded from the following measurements.
Perception of affect
In order to test whether the motion features had an impact on the perception of affect we performed a repeated measure analysis with the independent variables curvature, acceleration, embodiment and the dependent variables valence, arousal, dominance, positive affect and negative affect. The mean and standard deviation for the measurements for Roomba are summarized in Table IIa and the according values for iCat are summarized in Table IIb.
TABLE II: Mean and standard deviations. Reported in the format: mean/std. dev. (acc. = acceleration, cur. = curvature)
| acc. | cur. | valence | arousal | dominance | positive affect | negative affect |
|---|---|---|---|---|---|---|
| low | low | 4.89/0.32 | 6.00/0.20 | 4.33/0.18 | 21.00/1.10 | 15.50/1.00 |
| low | med. | 4.11/0.29 | 6.06/0.30 | 4.11/0.24 | 20.61/1.35 | 14.50/0.85 |
| low | high | 5.44/0.28 | 5.17/0.32 | 3.94/0.24 | 21.56/1.57 | 17.72/0.89 |
| med. | low | 5.67/0.31 | 5.28/0.29 | 3.78/0.28 | 20.78/1.26 | 17.06/0.85 |
| med. | med. | 4.56/0.27 | 5.17/0.22 | 4.00/0.34 | 21.00/1.61 | 14.56/0.83 |
| med. | high | 3.89/0.25 | 4.33/0.23 | 4.11/0.27 | 24.06/1.89 | 16.00/1.15 |
| high | low | 5.39/0.37 | 3.11/0.20 | 5.22/0.29 | 24.44/1.57 | 19.50/1.14 |
| high | med. | 3.67/0.26 | 3.61/0.28 | 5.11/0.35 | 26.56/1.54 | 16.78/1.04 |
| high | high | 5.00/0.28 | 2.67/0.29 | 4.11/0.14 | 27.11/1.37 | 20.28/1.51 |
| Average | 4.73/0.29 | 4.60/0.26 | 4.30/0.26 | 23.01/1.47 | 16.88/1.03 | |
(a) Mean and standard deviation for Roomba (N=18)
| acc. | cur. | valence | arousal | dominance | positive affect | negative affect |
|---|---|---|---|---|---|---|
| low | low | 5.39/0.29 | 6.39/0.27 | 3.89/0.18 | 16.11/1.26 | 16.67/1.13 |
| low | med. | 3.83/0.34 | 5.72/0.21 | 4.17/0.19 | 22.89/1.18 | 15.17/0.70 |
| low | high | 5.06/0.30 | 5.61/0.29 | 3.94/0.25 | 18.61/2.03 | 14.89/1.08 |
| med. | low | 5.17/0.22 | 5.22/0.25 | 4.22/0.24 | 20.33/0.71 | 14.67/0.63 |
| med. | med. | 3.94/0.24 | 5.17/0.22 | 4.17/0.28 | 22.50/1.64 | 13.89/1.00 |
| med. | high | 4.39/0.29 | 3.56/0.29 | 4.11/0.36 | 26.89/1.04 | 17.28/1.00 |
| high | low | 4.44/0.37 | 3.28/0.21 | 5.44/0.35 | 28.67/1.01 | 13.94/1.00 |
| high | med. | 4.17/0.25 | 3.83/0.22 | 4.61/0.18 | 25.44/1.08 | 19.33/0.96 |
| high | high | 4.78/0.31 | 3.11/0.27 | 3.89/0.29 | 25.17/1.23 | 17.89/1.37 |
| Average | 4.57/0.29 | 4.65/0.25 | 4.27/0.26 | 22.96/1.24 | 15.97/0.99 | |
(b) Mean and standard deviation for iCat (N=18)
The significance levels and partial eta square effect sizes for the main and interaction effects are reported in Tables IVa and IVb. Mauchly’s test indicated that sphericity was for none of the cases violated, therefore degrees of freedom did not have to be corrected.
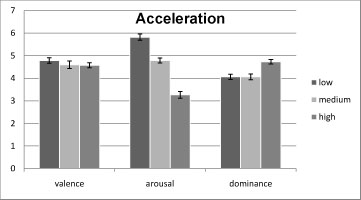
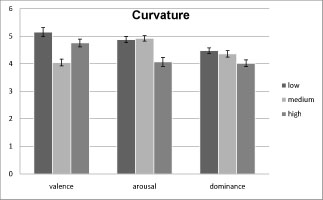
From Table IVa it can be seen that the embodiment had no main effect on the measurements, but that in general acceleration and curvature showed significant effects. Interestingly, acceleration had no effect on valance. The marginal means for acceleration, curvature and embodiment are exemplary visualized for the SAM scale in Fig. 5. From the graphs it can be seen that acceleration is correlated to arousal, but that there is no effect on valance. In contrast, curvature has an influence on all three measures, even though not all levels differed significantly from each other.
(a) Marginal means for acceleration
(b)
Marginal
means
for
curvature
(c)
Marginal
means
for
embodiment
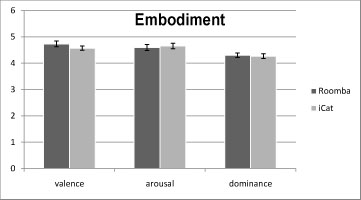
Fig. 5: Marginal means for acceleration, curvature and embodiment using the SAM scale.
| valence | arousal | dominance | PA | NA | |
|---|---|---|---|---|---|
| V | 1.00 | 0.11 | -0.17 | -0.38 | 0.30 |
| A | 0.11 | 1.00 | -0.10 | -0.28 | 0.05 |
| D | -0.17 | -0.10 | 1.00 | 0.28 | -0.19 |
| PA | -0.38 | -0.28 | 0.28 | 1.00 | 0.02 |
| NA | 0.30 | 0.05 | -0.19 | 0.02 | 1.00 |
TABLE III: Mean correlation values of the PAD and PA-NA space. (PA = positive affect, NA = negative affect
We compared the results from the PANAS and SAM scales and found both to be similarly responsive to the manipulations of the independent variables. In our repeated measure design, we calculated for every experimental condition a correlation table for the five measurements, resulting in 18 tables with 5x5 entries. We calculated a mean correlation table by averaging over the factors. The mean correlation values are reported in Table III. The highest absolute value was found between valence and positive affect. However, comparing the significance values, the PAD model indicated that acceleration has no effect on the perceived valence, which was not visible when expressed in the positive and negative affect dimensions. Additionally, there was some discrepancy in the interaction between acceleration and curvature. While in the PAD space all dimensions showed a significant interaction, this could not be reported on the negative affect axis. Furthermore, in the PAD space there was no interaction between curvature and embodiment visible. A similar observation can be made when analyzing the three way interaction of acceleration, curvature and embodiment. Only along the valence axis this interaction was significant, while both, the positive and negative dimensions showed significance.
Relation of motion features to perceived affect
In order to estimate a relation between the motion and affective space, we performed a linear regression analysis. As model parameters we used the linear and squared terms of acceleration and curvature as well as the linear interaction between those two. We did not include the embodiment, because it did not have a main effect in the previous analysis. Furthermore, we only analyzed a relationship dependent on the levels of acceleration and curvature in order to be able to compare between the different embodiments. From the resulting five parameters, we searched for the best predictors using a stepwise selection in a linear regression. That is, in every step the predictor that contributed the most to minimize the residual error was chosen. The results are summarized in Table V. The first column gives the order of the predictors, the second column gives the quality of the approximation, i.e., how much of the variance is accounted for by the model the third column gives the corresponding ANOVA results for testing the approximation. First, from these values it can be seen that most of the information for perceived arousal is carried in the acceleration parameter of the motion. Secondly, even if all ANOVAs report significant results, only small percentages of the variance could be predicted with these simple models. This is most evident for the PA-NA space in which the variance of the negative affect dimension cannot conclusive be explained with the calculated models.
(a) Main effects of acceleration, curvature and embodiment
| acceleration | curvature | embodiment | |||||||
|---|---|---|---|---|---|---|---|---|---|
| F | p | p.η2 | F | p | p.η2 | F | p | p.η2 | |
| V | .755 | .478 | .043 | 15.726 | .000 | .481 | 2.018 | .174 | .106 |
| A | 114.112 | .000 | .870 | 19.546 | .000 | .535 | .230 | .638 | .013 |
| D | 11.255 | .000 | .398 | 4.687 | .016 | .216 | .084 | .776 | .005 |
| PA | 28.061 | .000 | .623 | 4.336 | .021 | .203 | .014 | .909 | .001 |
| NA | 9.457 | .001 | .357 | 3.857 | .031 | .031 | 3.871 | .066 | .185 |
(b) Interaction effects of acceleration, curvature and embodiment
| acc.*cur. | acc.*emb. | cur.*emb. | acc.*cur.*emb. | ||||||||
|---|---|---|---|---|---|---|---|---|---|---|---|
| F | p | p.η2 | F | p | p.η2 | F | p | p.η2 | F | p | p.η2 |
| 4.331 | .004 | .203 | .146 | .865 | .009 | .381 | .686 | .022 | 4.215 | .004 | .199 |
| 3.109 | .021 | .155 | 1.708 | .196 | .091 | .704 | .502 | .040 | 1.708 | .158 | .091 |
| 4.157 | .005 | .196 | .727 | .491 | .041 | .173 | .842 | .010 | 1.019 | .404 | .057 |
| 2.843 | .031 | .143 | 2.077 | .141 | .109 | 1.027 | .369 | .057 | 3.747 | .008 | .181 |
| 1.990 | .106 | .105 | 1.033 | .367 | .057 | 4.005 | .027 | .191 | 5.202 | .001 | .234 |
TABLE IV: Significance values for the effects of the independent variables on the measurements and and partial η2 effect sizes. (N=18) V =Valence, A=Arousal, D=dominance, PA=positive affect, NA=negative affet
During the final interview, all but one participant reported that they had the impression that the robots clearly had different emotions or were in particular moods. When asked to describe the observed behaviors, all participants used emotional adjectives to describe the robots’ behavior, e.g., “…this one was a little moody. It seemed to be not very happy with what he was doing.”(participant 6). All participants consistently attributed animacy and almost all participants perceived some type of personality.
| predictors | Adjusted R2 | ANOVA | |
|---|---|---|---|
| V | (1) a * κ | 0.10 | F(1,616)=7.26, p = 0.07 |
| A | (1) a2(2) κ2(3) a * κ | 0.471 | F(3,614)=184.03, p < 0.001 |
| D | (1) a2(2) a * κ(3) κ | 0.10 | F(3,614)=23.86, p < 0.001 |
| PA | (1) a2(2) κ | 0.106 | F(2,615)=37.70, p < 0.001 |
| NA | (1) a2(2) a(3) κ2(4) κ | 0.063 | F(4,613)=11.41, p < 0.001 |
TABLE V: Stepwise linear regression results.
Discussion
The first reaction of all participants after the experiment has been that they were surprised by the variety of emotions expressed by the devices. They reported to have almost always an immediate impression on how the robot felt in a given condition, and had no difficulties in filling in the scales.
Most interestingly, the above results suggest that there is no significant difference between the embodiments, despite their very different physical setup. For both embodiments and in both scales, participants interpreted the motion patterns in the same emotional categories. This result has interesting implications on the design of robotic behavior, because it suggests that motion design tools can be used across embodiments. Even more specific, the results show that acceleration is correlated with the perceived arousal. Therefore, the perceived arousal can be controlled by varying the acceleration parameter of the motion. However, no such direct relationship between acceleration or curvature and valence could be found.
Pollick et al. estimated that most of the information on the valence axis is encoded in the frequency relations between limb movements [25]. However, in our experiment the Roomba robot did not possess limbs, but participants were still able to perceive different levels of affect. Our results suggest that the valence information is at least partly encoded in the interaction between acceleration and curvature. However, this model did not explain a sufficient amount of the variance to be conclusive. Analysis of further motion features and models is required to isolate the valence information from motion signals.
The significant interaction between acceleration and curvature suggests that these parameters are not perceived independently from each other. Even though the dimensions of acceleration and curvature are independent in movement space and the dimensions valance, arousal and dominance are independent in affect space. They interfere in the cognitive process that transforms between the two spaces. This interaction is also influenced by the embodiment, as can be seen in the three way interaction between acceleration, curvature and embodiment (see IVb). Based on the spontaneous responses of the participants, we assume that this effect resulted mainly from the expectations that the participant had regarding the behavior of the robots. However, the change of perception can be mainly attributed to the change of the motion characteristics and has similar tendency for both embodiments. For example, leaving the curvature constant but changing the acceleration from low to high was interpreted in the Roomba condition as a change from “careful”(participant 27), “moving like a cat that wants attention”(participant 6), “not determined wandering around” (participant 9) to “stressed”(participant 4), “aggressive; guarding an area”(participant 25) or even “very proud, exhibiting a macho kind of behavior” (participant 7). The same manipulation in the iCat condition resulted in a change from “falling asleep” (participant 4) and “calm and relaxed” (participant 19) to “nervously searching” (participant 16) and “very chaotic and unorganized” (participant 6). More research needs to be done to clarify the exact structure of the manipulations.
It furthermore remains to be tested if discrepancies between the PAD space and positive-negative affect space can be explained by being a rotational variant of the same space. For example, Mehrabian claimed that the PANAS model lacks validity, because it does not capture certain aspects of the affective space [22]. Furthermore, some participants reported that they missed words on the PANAS scale such as “happy”, “tired”, “moody”, “confused” or “disinterested” and therefore rated the other items lower, because they did not seem to fit their impression. A specialized questionnaire would have to be developed that captures possible interpretations of motion patterns better than the PANAS. In contrast there were no problems with the SAM scale.
Conclusions
In this study we investigated the relation between robot motion and the perceived affective state of the robot. From literature we derived two motion characteristics that seemed to be most influential for the perceived affective state, namely acceleration and curvature. We systematically varied both conditions and tested the perceived affect with two embodiments. For assessing affect we selected the PANAS and SAM scales, which are supposed to be rotational variants of the same space. With our variations we were able to trigger the perception of different emotions.
We found that both parameters, acceleration and curvature, have a significant effect on the perceived affective state. However, there were slight differences between the two emotional models that were difficult to explain by being a rotational variant. In general, we found the SAM to be more appropriate, because all participants were able to report their general impression according to the pictographic representation of the self-assessment manikins.
Furthermore, we found that the embodiment had no significant main effect on the perceived affective state, stressing the importance for carefully designed robot behaviors. Analyzing the relationship in more detail, we found that acceleration carries most of the information for perceived arousal. However, no such simple relationship could be found for the dimensions of valence and dominance or for the dimensions of positive affect and negative affect. Our results indicate that the information for valence is at least partly carried by a linear interaction between curvature and acceleration.
From these results we can derive design knowledge for the design of movement behaviors of social robotic interfaces. If the designer wants to convey different levels of arousal he can adjust the acceleration parameter of the animation accordingly. Motion can therefore be used as a design modality to induce a desired perception. Even stronger, the effect of manipulations also holds across embodiments. Therefore, tools for designing motion trajectories can be generalized and applied to multiple embodiments. Further research is needed to investigate such a model for valence. Especially if a designer intends to convey a positive or negative emotion it has to be analyzed what motion features carry this valence information in order to be able to predict user responses.
References
- L. F. Barrett, B. Mesquita, K. N. Ochsner, and J. J. Gross. The experience of emotion. In Annual Review of Psychology, volume 58, pages 373–403, Jan. 2007.
- C. Bethel and R. Murphy. Survey of Non-facial/Non-verbal Affective Expressions for Appearance-Constrained Robots. Systems, Man, and Cybernetics, Part C: Applications and Reviews, IEEE Transactions on, 38(1):83–92, 2008.
- P. W. Blythe, P. M. Todd, and G. F. Miller. Simple Heuristics That Make Us Smart, chapter How Motion Reveals Intention: Categorizing Social Interactions, pages 257 – 285. Oxford University Press, 1999.
- M. Bradley and P. Lang. Measuring emotion: the self-assessment manikin and the semantic differential. Journal of behavior therapy and experimental psychiatry, 25(1):49–59, 1994.
- A. Camurri, I. Lagerlöf, and G. Volpe. Recognizing emotion from dance movement: comparison of spectator recognition and automated techniques. Int. J. Hum.-Comput. Stud., 59(1-2):213–225, 2003.
- R. Cowie, E. Douglas-Cowie, N. Tsapatsoulis, G. Votsis, S. Kollias, W. Fellenz, and J. Taylor. Emotion recognition in human-computer interaction. Signal Processing Magazine, IEEE, 18(1):32–80, 2001.
- J. R. Crawford and J. D. Henry. The positive and negative affect schedule (PANAS): Construct validity, measurement properties and normative data in a large non-clinical sample. British Journal of Clinical Psychology, 43:245–265, 2004.
- S. Denham, T. Wyatt, H. Bassett, D. Echeverria, and S. Knox. Assessing social-emotional development in children from a longitudinal perspective. British Medical Journal, 63(Suppl 1):i37–i52, 2009.
- P. Ekman and W. Friesen. Unmasking the face: a guide to recognizing emotions from facial clues. Prentice-Hall, Englewood Cliffs, NJ, 1975.
- J. Forlizzi and C. DiSalvo. Service robots in the domestic environment: a study of the Roomba vacuum in the home. In ACM SIGCHI/SIGART International conference on Human-robot interaction (HRI), pages 258–265, New York, NY, USA, 2006. ACM.
- V. Gaur and B. Scassellati. Which motion features induce the perception of animacy? In International Conference for Developmental Learning, Bloomington, Indiana, 2006.
- A. Grizard and C. L. Lisetti. Generation of facial emotional expressions based on psychological theory. In 1rst Workshop on Emotion and Computing at KI 2006, 29th Annual Conference on Artificial Intelligence, pages 14–19, 2006.
- F. Heider and M. Simmel. An experimental study of apparent behavior. Journal of Psychology, 57:243–249, 1944.
- J. Humrichouse, M. Chmielewski, E. A. McDade-Montez, and D. Watson. Emotion and Psychopathology, chapter Affect assessment through self-report methods, pages 13–34. American Psychological Association (APA), 2007.
- J.F. Schouten School for User System Interaction Research. Participant database: http://ppdb.tm.tue.nl/, 2009.
- D. K. I could be you: The phenomenological dimension of social understanding. Cybernetics and Systems, 25(8):417–453, 1997.
- P. Lang, M. Bradley, and B. Cuthbert. International affective picture system (IAPS): Instruction manual and affective ratings. The Center for Research in Psychophysiology, University of Florida, 1999.
- R. Larsen and E. Diener. Promises and problems with the circumplex model of emotion. Emotion, 13:25–59, 1992.
- J.-H. Lee, P. Jin-Yung, and T.-J. Nam. Emotional interaction through physical movement. In Human-Computer Interaction,12th International Conference, pages 401–410, 2007.
- M. Lewis, J. M. Haviland-Jones, and L. F. Barrett, editors. Handbook of Emotions (Third Edition). The Guilford Press, 2008.
- A. Mehrabian. Framework for a comprehensive description and measurement of emotional states. Genetic, Social, and General Psychology Monographs, 121(3):339, 1995.
- A. Mehrabian. Comparison of the pad and panas as models for describing emotions and for differentiating anxiety from depression. Journal of Psychopathology and Behavioral Assessment, 19(4):331–357, 1997.
- T. Minato and H. Ishiguro. Construction and evaluation of a model of natural human motion based on motion diversity. In HRI ’08: Proceedings of the 3rd ACM/IEEE international conference on Human robot interaction, pages 65–72, New York, NY, USA, 2008. ACM.
- H. Mizoguchi, T. Sato, K. Takagi, M. Nakao, and Y. Hatamura. Realization of expressive mobile robot. In 1997 IEEE International Conference on Robotics and Automation, Proceedings. Albuqueraue, NM, April, 1997.
- F. Pollick, H. Paterson, A. Bruderlin, and A. Sanford. Perceiving affect from arm movement. Cognition, 82(2):51–61, 2001.
- J. Russell. A circumplex model of affect. Journal of Personality and Social Psychology, 39(6):1161–1178, 1980.
- M. Saerbeck and C. Bartneck. Online calibration for low-cost consumer robots using neural networks. Submitted, 2009.
- M. Saerbeck and A. J. van Breemen. Design guidelines and tools for creating believable motion for personal robots. In Robot and Human interactive Communication (RO-MAN), pages 386–391, 2007.
- B. J. Scholl and T. P. D. Perceptual causality and animacy. Trends in Cognitive Science, 4(8):229–309, Jul 2000.
- J.-Y. Sung, R. E. Grinter, H. I. Christensen, and L. Guo. Housewives or technophiles?: understanding domestic robot owners. In ACM/IEEE International conference on Human-robot interaction (HRI), pages 129–136, New York, NY, USA, 2008. ACM.
- J.-Y. Sung, L. Guo, R. E. Grinter, and H. I. Christensen. My Roomba is rambo: Intimate home appliances. In UbiComp 2007: Ubiquitous Computing, volume 4717 of Lecture Notes in Computer Science, pages 145–162. Springer Berlin / Heidelberg, 2007.
- P. D. Tremoulet and J. Feldman. Perception of animacy from the motion of a single object. Perception, 29(8):943–951, 2000.
- D. Watson, L. Clark, and A. Tellegen. Development and validation of brief measures of positive and negative affect: The PANAS scales. Journal of Personality and Social Psychology, 54(6):1063–1070, 1988.
This is a pre-print version | last updated March 8, 2010 | All Publications