DOI: 10.1037/1931-3896.1.2.114 | CITEULIKE: 1394368 | REFERENCE: BibTex, Endnote, RefMan | PDF ![]()
Bartneck, C., Masuoka, A., Takahashi, T., & Fukaya, T. (2007). An Electronic Museum Guide in Real Use. Psychology of Aesthetics, Creativity, and the Arts, 1(2), 114-120
An Electronic Museum Guide in Real Use
Department of Industrial Design
Eindhoven University of Technology
Den Dolech 2, 5600MB Eindhoven, NL
christoph@bartneck.de
ATR Media Information Science Laboratory
2-2-2 Hikaridai, Seika-cho
Soraku-gun, Kyoto 619-0288, Japan
[amasuoka, toru, tfukaya]@atr.jp
Abstract - Within the Contextual Model of Learning framework, the authors conducted a study with electronic handheld guides at the Van Abbe Museum. The authors offered the general electronic tour using the ubiNext system for the duration of two weeks. This study investigated whether the use of multimedia content would increase the usage of the system compared to only visual content. In addition the authors were interested if the age of the visitors would influence the system’s usage. The authors also investigated whether individual visitors use the system more compared to visitors who experience the museum in couples. More than half of the visitors only requested information for five or less objects independently of the visitor’s age. Technical problems and usability issues might have caused many visitors to stop using ubiNext. Among those participants who heavily used the system, the display of multimedia content lead to an increased usage compared to visual content only.
Keywords: museum, electronic, guide, pda, learning
Introduction
Museums increasingly acknowledge the need to provide ad equate educational services to their visitors. To guide the museums’ educational efforts first theoretical frameworks were developed. The Contextual Model of Learning framework is among the most renowned (Falk & Dierking, 2000). It identifies three overlapping contexts: the personal context, the sociocultural context, and the physical context. All three contribute to and influence the interactions and experiences that people have when engaging in free-choice learning activities such as visiting museums. The personal context consists of four factors: Motivation and Expectations, Interest, Prior Knowledge and Experience, Choice and Control. The sociocultural context contains three factors: Within-Group Sociocultural Mediation, Facilitated Mediation by Others and Culture. The physical context includes four factors: Advance Preparation, Setting, Design, and Subsequent Reinforcing Events and Experiences. Together, these 11 factors offer a conceptual framework that describes the influences and interactions between the museum and its visitors.
This Contextual Model of Learning framework formed the base upon which the ubiNext museum guide system was developed. It allows the users to plan a tour on a website prior to their actual museum visit. At the museum the system guides the users through the museum using personal digital assistants (PDA). Besides offering the users their preplanned tours, it also offers an algorithmic recommendation system and fixed tours that have been developed by the museum staff. After the museum visit, the users can login at the website again to review the art objects they visited.
In an earlier study, this system was tested at the Van Abbe Museum in Eindhoven, the Netherlands (Bartneck, Masuoka, Takahashi, & Fukaya, 2006).Several school classes were asked in the framework of their art classes to plan their tour at the website and then to visit the museum itself. This article presents the follow-up study that tries to extend the original work while maintaining most of the methodology to ensure comparable results.
Several choices in the methodology of the original experiment limit the generalizability of its results. School classes are an essential part of the educational efforts of the Van Abbe Museum, but it forms a very homogenous age group. These teenagers grew up with information technology and frequently use computers and the Internet. The majority of the general museum visitors are much older and have less or no experiences with computers and the Internet. For this study, we therefore invited the general public to participate.
Another limiting factor has been that the students were required to participate in the study within the framework of their art classes. Even thought many students enjoyed the museum visit, they did not volunteer, and they simply did not complete their tour planning homework. This mild pressure from the school might have influenced the results. In our current study we therefore only used participants that voluntarily decided to join.
Furthermore, the previous participants were always asked to form couples, so that their conversation could be recorded. The general museum visitors may also come in couples, but many visit the museum alone. Sharing a PDA with another person might have been a different experience from operating it alone; therefore, the participants in this study were free to either use one PDA together or to have one individually.
Lastly, the results of the previous study showed that the ubiNext system did not significantly perform better compared to the traditional paper guide. We had concluded that the PDA had only shown text and pictures and had not used the full potential of a PDA. In this study we added audio commentary and movies to the tour, while also offering the old version for comparison.
Similar to our previous experiment we attempted to measure the visitors’ learning experience to determine the quality of the system. It has to be acknowledged that the concept of “learning experience” remains on an abstract level. Not just the repeatable knowledge of art, such as the recognition of art objects and their key data, is considered a learning experience, but also personal experiences that might influence the visitors’ behavior in the future (Falk & Dierking, 2000). A visitor might, for example, remember the atmosphere of a Picasso painting years after visiting the exhibition and use this knowledge to interpret another art object or decide to spend a vacation in France. Falk and Dierking suggest, at the risk of oversimplifying the complexity of the learning process, that the nature of learning in free-choice settings, such as museums, can be described in three simple statements: learning begins with the individual, learning involves others, and learning takes place somewhere. This definition is so broad that it comes close to having to admit that it is not clear at all what learning experience is. Anything could be a learning experience.
The operationalization of such an abstract concept is difficult. Still, certain behaviors of the visitors are fairly good indicators for it. Clearly, the longer visitors indulge in an exhibition to see many art objects, the higher the chance they had a learning experience (Smith & Smith, 2003). Furthermore, the more discussions and reflections the visitors have with each other about the exhibited art the more likely they had a learning experience (Smith & Smith, 2003). This indicator is explicitly mentioned as factor five (Within Group Sociocultural Mediation) in the Contextual Model of Learning framework.
Based on the extensions mentioned above we define four re search questions for this study:
- Do visitor from different age groups have different learning experiences using the ubiNext system?
- Does the presentation of audiovisual media improve the visitors’ learning experience compared to the presentation of visual media only?
- Do visitors who operate a PDA by themselves have a different learning experience compared to couples that share a PDA?
- Do visitors who planned their tour prior to the actual museum visit have a better learning experience compared to visitors who did not plan their tour?
Method
We conducted a 2 (media) 2 (group) between participants experiment. The two media conditions were visual or audiovisual. In the visual condition only text and still images were displayed, and in the audiovisual condition movies and audio commentary were presented. The two group conditions consisted of individual and couple. In addition, the participants could either prepare their visit using the ubiNext Internet ser vice or not prepare their visit. We could not manipulate this factor. In the following text, the italic style is used to highlight the conditions’ names.
Measurements
The following measurements can be considered indicators for the visitor’s learning experience.
Demographics. Age and gender of the participants were re corded. For the couples, their average age was recorded, and the gender of the couple was recorded as male, mixed, or female.
Conversation. The participants’ utterances were recorded on a small audio recorder that was hung around the neck of one participant. This recording was optional since it poses an intrusion into the visitors’ privacy. After the experiment, the utterances were analyzed. First, the recording was cropped from the point that the participants entered the exhibition to when they exited the exhibition. The duration was noted as speechTotal. The utterances in the recording were then grouped into the following categories and the duration of the categories was noted. Therefore instead the number of utterances in a category the sum of how long participants talked about each category was measured.
- Art—the participants talked about art objects, related concepts and their reaction to it.
- Handheld—the participants discussed the functioning of the handheld device.
- Navigation—the participants conversed about where they are and where they want to go.
- NotAudible— utterances which could not be understood, for example when they were too silent.
- OffTopic—the participants talked about topics that were not connected to the exhibition or the study. For example, the participants talked about how much or how little they liked a certain neighbor.
- Silence—a pause of two seconds and longer was defined as silence. This is a standard threshold in speech analysis. Pauses shorter than two seconds are therefore considered to be part of the conversation flow in the other categories.
- Troubleshooting—the participants talked about technical problems and may have asked the experimenter for help.
When two or more groups of participants talked to each other, the utterances were categorized as Group Interaction. Within Group Interaction, the same subcategories exist as used above: Group Art, Group Handheld, Group Navigation, Group Not-Audible, Group OffTopic, Group Silence, and Group Troubleshooting.
Behavior. Every time the participants executed an action on the handheld device, such as requesting information about an art object, a log file entry on the server was created automatically. Based on this log file data, several measurements are available:
DurationOfUse—the duration from the first user action to the last user action.
NumberOfObjects—the number of objects that the participant requested information about. These measurements contain a certain number of errors, since a participant could request the same documents several times. Due to technical problems, a request might have also been reloaded by the system. The size of this error is not clear, but it can be assumed that it is evenly distributed.
Qualitative. To gain a more qualitative insight into the visitor’s experiences with the system, we offered the visitors to write their comments and ideas into a feedback book.
Setup
The experiment was conducted in January 2006 at the Van Abbe Museum in Eindhoven, the Netherlands. Thirty art objects in the museum were entered into the ubiNext system. Eleven object information screens consisting of still images and text were ac companied by audio commentary and another 11 featured video clips while only eight were limited to the basic visual information. The 30 art objects were spread across 12 rooms on three floors, and labels containing the identification number of the object were attached below the regular exhibition labels.
Participants
The age of the 189 people who participated in the study ranged between 12 and 75 (M 46, SD 16.5). Seventy of the participants were female and 59 were male. Forty-three couples agreed to have their conversations recorded.
Materials
The 20 Dell Axim C51v PDAs featured a 3.7 in color display that displayed 480 640 pixels. They wirelessly communicated with the ubiNext server using the 802.11b standard. Stereo head phones were attached to the PDAs to play the audio content (see Figure 1). Due to the fragmented architecture of the Van Abbe Museum, it was necessary to install eight access points to enable the PDAs to wirelessly communication with the server. The server itself was equipped with two network cards. One would be as signed to the museum internal communication with the PDAs and a second would provide the web service to the Internet users.
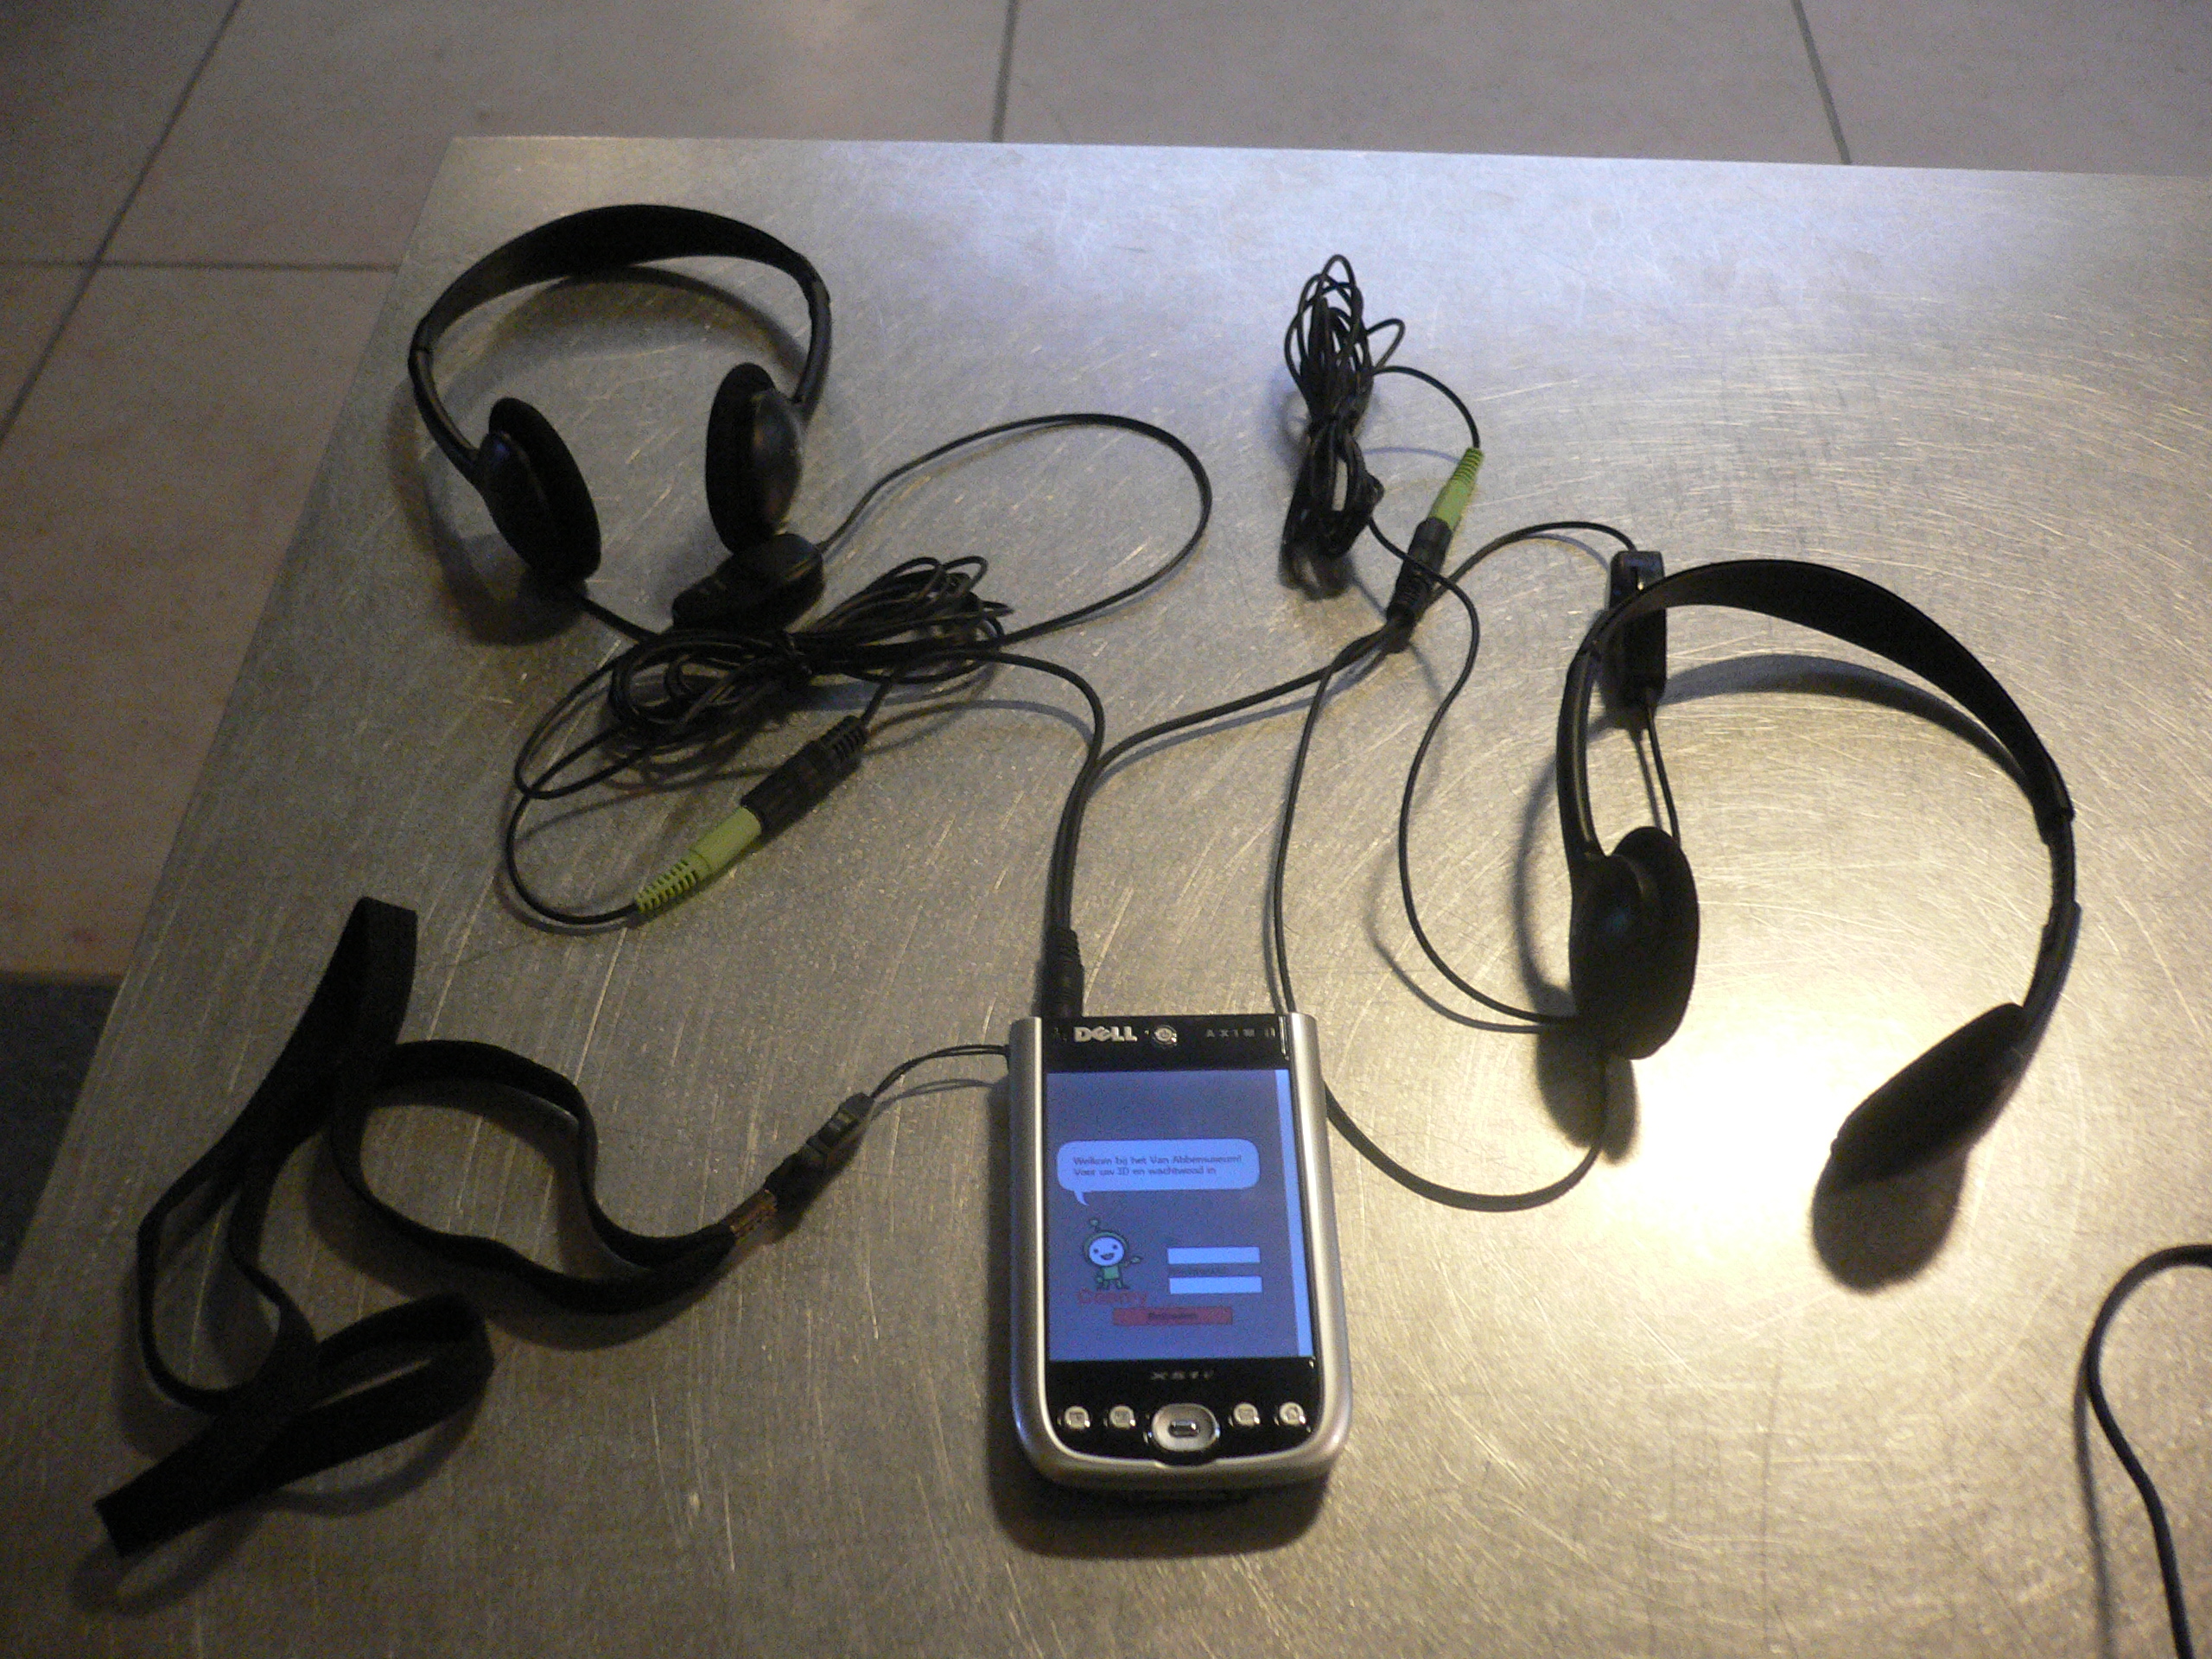
Figure 1. The Dell Axim C51v with two headsets.
The conversations of the participants were recorded using a small MP3 player (Creative MuVo V200) that was hung around their necks. The devices’ built-in microphone provided sufficient audio quality for the recording. The recordings were analyzed after the experiment using Noldus Observer.
Procedure
Prior to the experiment, the museum advertised the ubiNext service on its website and through newspapers and TV news. This should attract a sufficient number of participants visiting the tour planning website. After visitors entered the museum and purchased their tickets, they would pass the information desk, on which the ubiNext handout took place.
They were offered a free ubiNext tour, and after making a deposit they would be given a PDA. If they had planned a tour prior to their arrival at the museum, they could login the system with their existing user ID and password. If they did not plan their own tour, then they would receive a login and password at the information desk. After a short introduction given by the staff, they entered the museum and could experience the museum with the ubiNext system as long as they desired (see Figure 2).
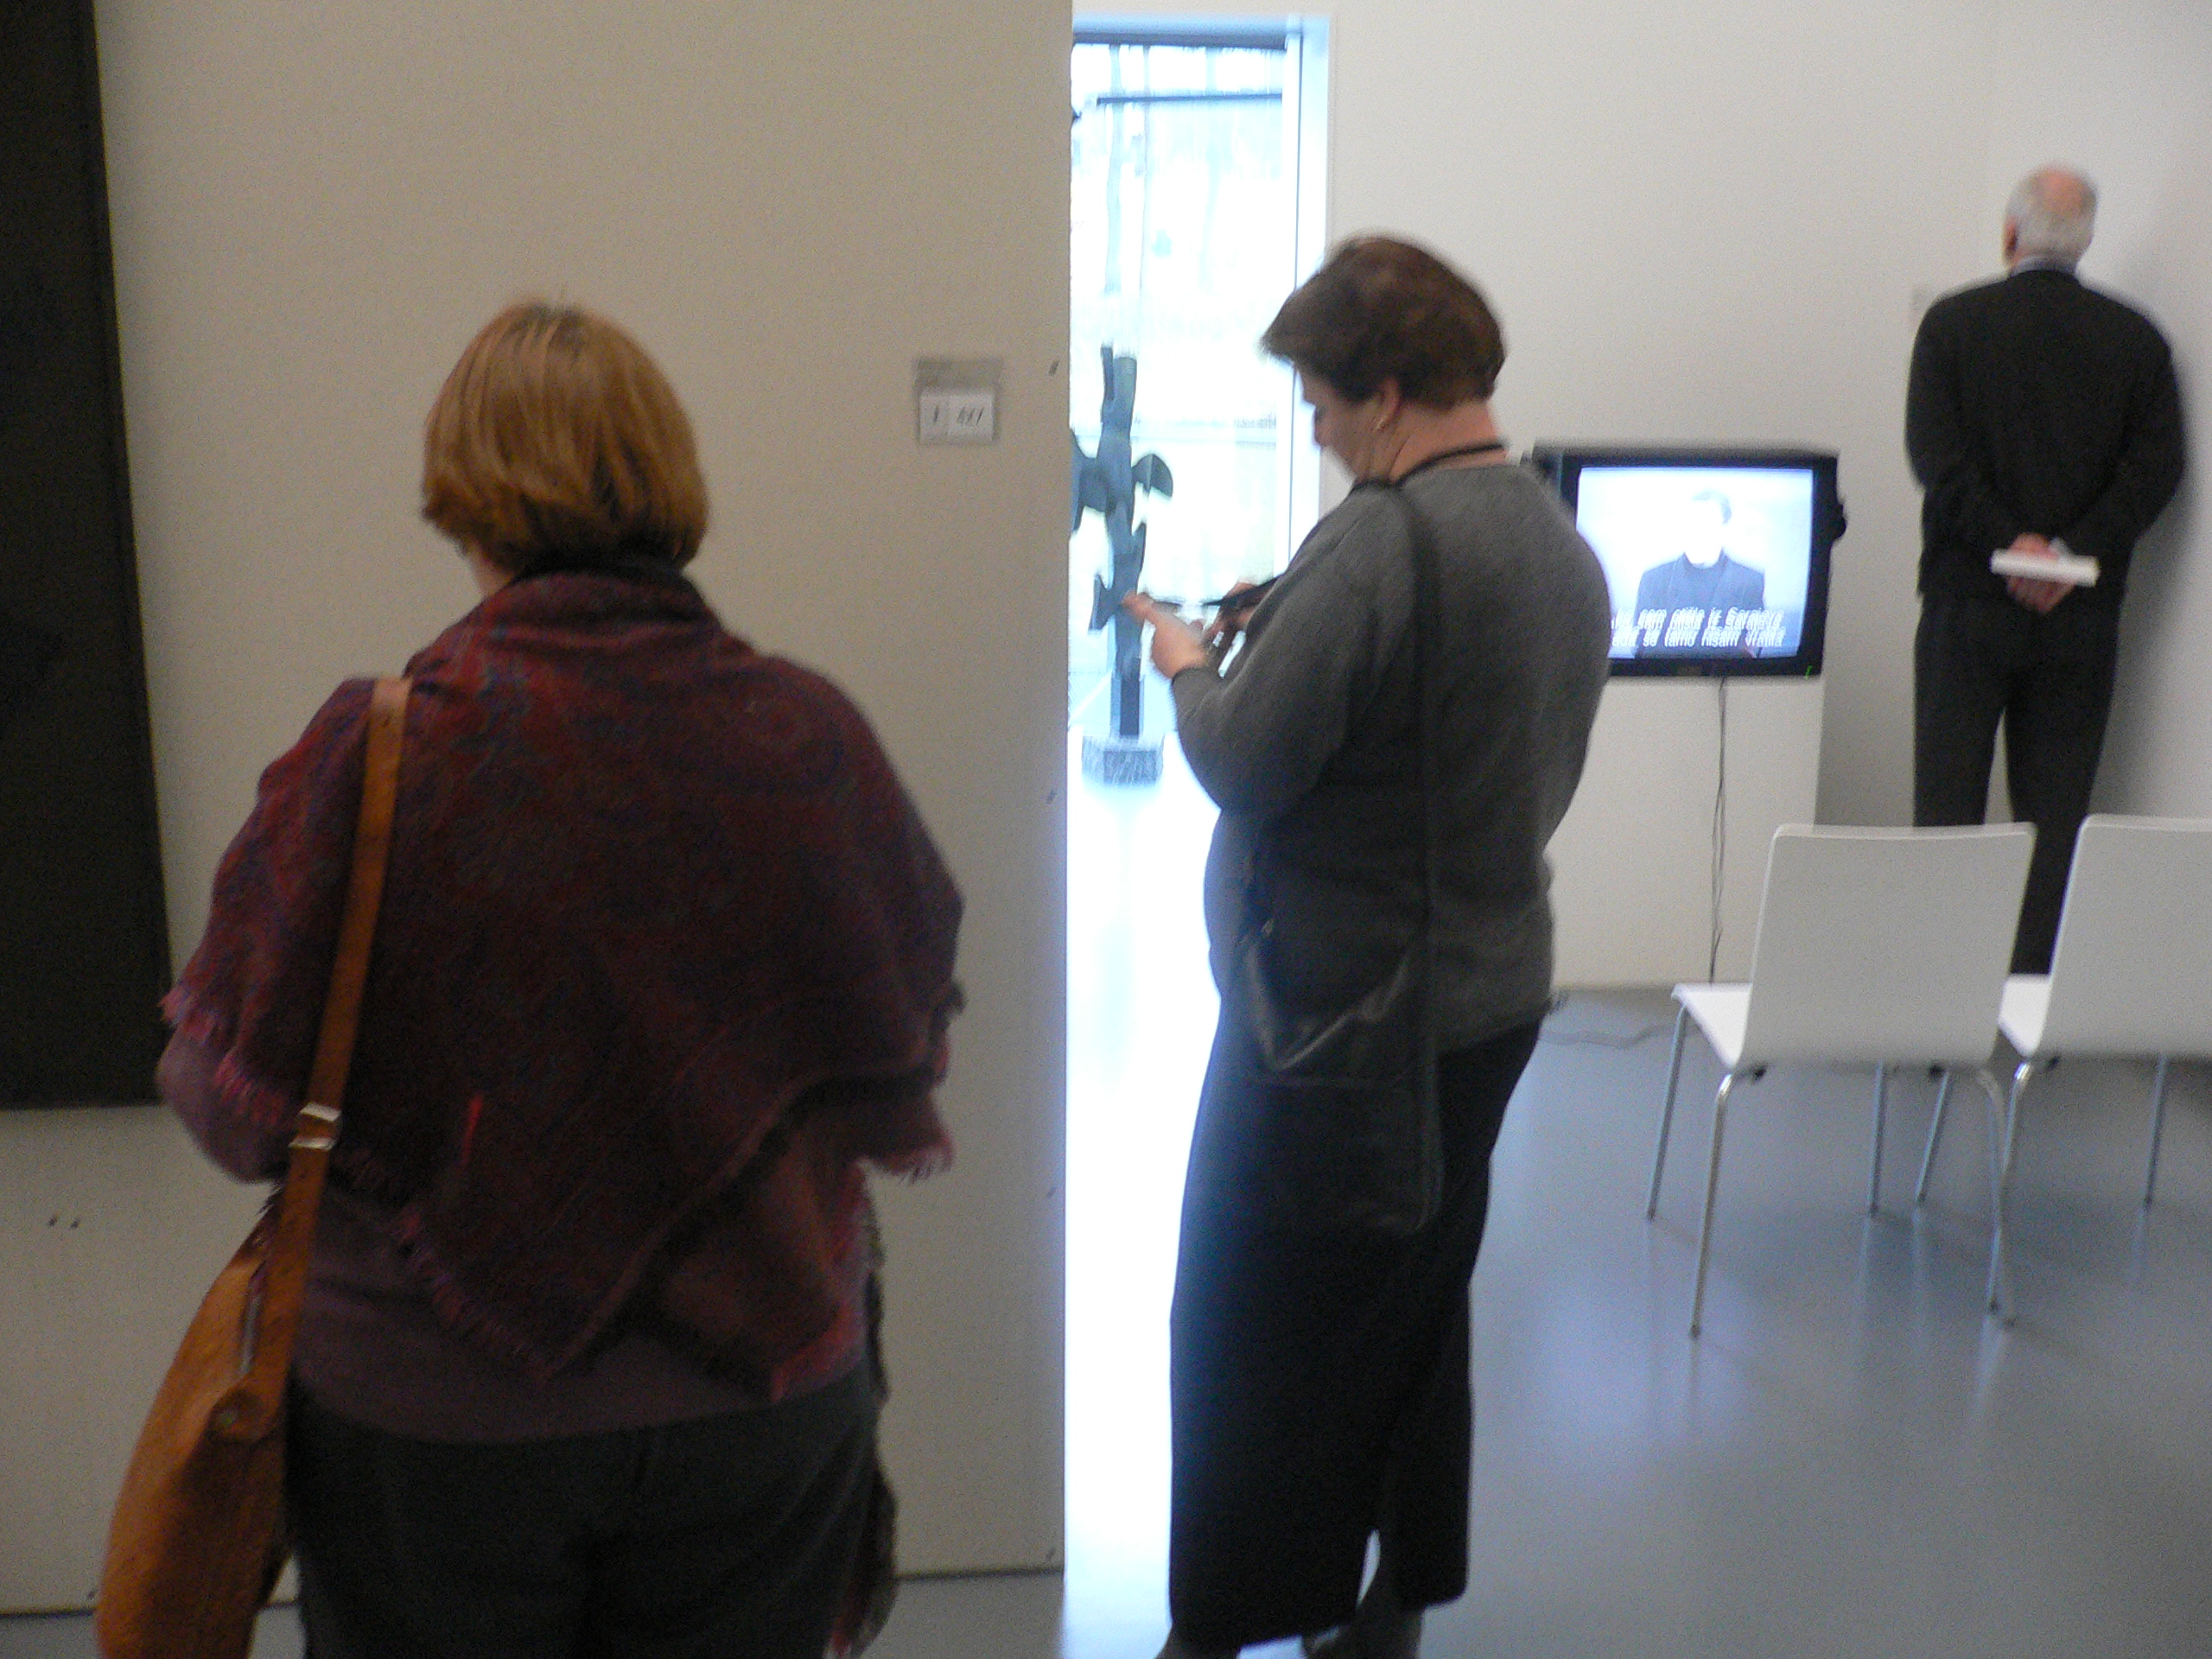
Figure 2. Visitors using ubiNext in the museum.
The museum volunteers guarding the museum were trained to help the visitor with their PDAs, but for serious technical problems the visitors had to return to the information desk in the entrance hall. Once the visitors were ready to leave the museum, they would return their PDAs and receive a postcard on which the address of the website together with their login and password were noted.
Results
The participants either used the PDA by themselves or in couples. One couple used the system far beyond any other participant, and it is likely that they individually used the PDA after each other and hence doubling the number of log entries on the server. Since the actions of this couple have been extremely out of the general trend, they were considered an outliner and excluded from the further analysis. From the remaining 187 people 71 participants used the PDA individually while 116 used them in couples. The data recorded for the couples were treated as being one participant which results in a total number of 129 (71+116/2) participants.
Sixty-five participants were using the PDA in the Visual condition while 64 participants used the PDA in the audiovisual condition. Sixty seven people prepared their visit by creating a tour using the ubiNext web service with an average of 5 objects per tour (SD 5.54). Only 11 from these 67 showed up at the museum and walked with their preplanned tour. One hundred eighteen participants did not prepare a tour.
From these 129 participants 14 did not use the system after it had been given to them and no data was recorded for them. Since they did not actually experience the system, they were excluded from the further analysis which brings the number of participants available for the analysis to 115. The participants were reasonable equally distributed across the four conditions (see Figure 3).
| Media | |||
|---|---|---|---|
| Visual | Audiovisual | ||
| Group | Individual | 31 | 29 |
| Couple | 26 | 29 | |
Figure 3. Distribution of the 115 participants across the four conditions.
An initial analysis of covariance (ANCOVA) in which Media and Group were the independent variables and Age and Preparation the covariants did not result in any significant differences in the dependent variables NumberOfObjects and DurationOfUse. Table 1 shows that the age of the participants did not result in significant differences in the NumberOfObjects.
| Age Range | M | N |
|---|---|---|
| 10–19 | 8.88 | 6 |
| 20–29 | 10.68 | 23 |
| 30–39 | 8.43 | 17 |
| 40–49 | 7.95 | 22 |
| 50–59 | 8.10 | 28 |
| 60–69 | 6.33 | 29 |
| 70–79 | 10.33 | 4 |
Table 1 Mean NumberOfObjects Across Age Groups
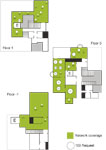
We then analyzed the distribution of participants across the NumberOfObjects they viewed, and Table 2 shows that more than half of the participants looked at five or less objects. Furthermore, when mapping the number of information request for each art object onto its location in the museum, it became clear that the majority of the participants used the system in rooms that were close to the entrance on floor zero (see Appendix). Considerable fewer objects were accessed on the other floors.
| NumberOfObjects | Number of participants |
|---|---|
| 0–5 | 70 |
| 6–10 | 22 |
| 11–15 | 20 |
| 16–20 | 6 |
| 21–25 | 7 |
| 26–30 | 4 |
Table 2 Distribution of Participants Across the NumberOfObjects
It can be assumed that one would have to at least use the PDA to request information about 10 objects to fully experience the system. Therefore we limited our further analysis to the 39 participants whose NumberOfObjects were equal or greater than 10. Figure 4 shows that there are too few participants in the Couple/ Audiovisual condition to gain meaningful statistical results. We therefore excluded the Group factor from the following analysis, which resulted in 25 participants being in the Visual condition and 14 in the Audiovisual condition.
| Media | |||
|---|---|---|---|
| Visual | Audiovisual | ||
| Group | Individual | 12 | 10 |
| Couple | 13 | 4 | |
Figure 4. Distribution of the 39 participants across the four conditions.
An ANCOVA with Media as the independent factor and Age and Preparation as covariants was conducted. Preparation had no significant influence on the measurements while Age had an al most significant, F(1, 35) 4.002, p .053 influence on DurationOfUse. Table 3 shows that there was little difference for the NumberOfObjects across the age groups. Media had a significant, F(1, 35) 4.363, p .044 influence on the NumberOfObjects. Participants viewed on average 15 objects in the Visual condition and 19 in the Audiovisual condition.
| NumberOfObjects | Duration Of Use | ||||
|---|---|---|---|---|---|
| Age | N | M | SD | M | SD |
| 10–19 | 2 | 12 | 1 | 0:36:20 | 0:15:36 |
| 20–29 | 10 | 18 | 7 | 0:20:37 | 0:10:10 |
| 30–39 | 6 | 12 | 2 | 0:31:30 | 0:05:40 |
| 40–49 | 7 | 16 | 7 | 0:29:37 | 0:19:30 |
| 50–59 | 8 | 18 | 6 | 0:31:18 | 0:16:43 |
| 60–69 | 5 | 17 | 4 | 0:36:20 | 0:14:37 |
| 70–79 | 1 | 22 | 0:59:35 | ||
Table 3 Means and Standard Deviations Across Age
The conversations of 43 participating couples were recorded. Eight of the recordings had severe problems, such as low audio quality or the participants switched the recording device off. Table 4 shows that there is a large duration difference between the recorded conversations (SpeechTotal) and the duration of PDA use (DurationOfUse). Most participants worked with the PDA for an average of 20 minutes before they would either bring the PDA back to the front desk or continue their museum tour without using the PDA.
| M | Mdn | SD | |
|---|---|---|---|
| DurationOfUse | 00:20:52 | 00:20:08 | 00:15:47 |
| SpeechTotal | 01:03:50 | 01:05:23 | 00:38:00 |
| Difference | 00:38:41 | 00:33:37 | 00:36:50 |
Table 4 Duration of Usage and Duration of Recorded Speech
On average more than half of the audio was recorded while the PDA was not used. This strongly biases the measurements as presented in Table 5. An ANCOVA with Media as the independent variable, Age and Preparation as the covariant was conducted, but no significant difference was detected.
| Visual | Audiovisual | |||
|---|---|---|---|---|
| Measurement | M | SD | M | SD |
| Art | 00:13:01 | 00:11:07 | 00:09:26 | 00:08:26 |
| Handhelt | 00:08:58 | 00:06:26 | 00:10:05 | 00:13:55 |
| Navigation | 00:05:58 | 00:17:16 | 00:05:05 | 00:10:03 |
| NotAudible | 00:05:28 | 00:09:59 | 00:07:01 | 00:11:51 |
| OffTopic | 00:05:51 | 00:10:15 | 00:04:04 | 00:03:48 |
| Silence | 00:18:52 | 00:18:21 | 00:25:35 | 00:23:30 |
| Troubleshooting | 00:00:52 | 00:01:42 | 00:00:50 | 00:01:48 |
| Undetermined | 00:00:20 | 00:00:44 | 00:00:21 | 00:00:45 |
| Grouptotal | 00:02:50 | 00:04:48 | 00:03:06 | 00:06:27 |
| Groupart | 00:01:49 | 00:03:20 | 00:00:33 | 00:01:02 |
| Grouphandhelt | 00:00:50 | 00:01:24 | 00:01:35 | 00:02:45 |
| Groupnavigation | 00:00:00 | 00:00:00 | 00:00:05 | 00:00:12 |
| GroupnotAudible | 00:00:00 | 00:00:02 | 00:00:15 | 00:00:51 |
| GroupoffTopic | 00:00:09 | 00:00:22 | 00:00:30 | 00:02:01 |
| Groupsilence | 00:00:00 | 00:00:00 | 00:00:03 | 00:00:15 |
| Grouptroubleshooting | 00:00:00 | 00:00:00 | 00:00:01 | 00:00:05 |
| Groupundetermined | 00:00:00 | 00:00:00 | 00:00:00 | 00:00:00 |
Table 5 Means and Standard Deviations of Speech Categories Measurement Visual Audiovisual
Technical Problems
During the experiment we encountered some practical and technical problems which might also be interesting for future museum guide developers. First, the network connection between the PDAs and the access points failed. We could identify two possible reasons. Sometimes the visitors would simply be out of range from the access points, such as when they entered the cafeteria. This problem could be relatively easy to overcome by installing more access points. A more serious problem is the roaming function of the PDAs. While the PDA’s operating system switches its communication from one access point to another, no communication with the server is possible. If the visitor tried to access information during this period, they would receive an error message, which caused several visitors to return to the information desk.
Discussion and Conclusions
More than half of the participants only requested information about five or less art objects. On average the participants used the system for about 20 minutes and stayed in the museum for around one hour. In our previous study the participants used the system much more. The reason might be that in our present study the participants volunteered to use the PDA and were free to use it as long as they wanted to. In our previous study we asked and supervised the usage far more, and the study was executed in the framework of the participants’ high school art class.
Through the mapping of the art object’s popularity on their location (see Appendix), it became clear that most visitors used the system in the rooms close to the entrance and far less in other rooms. It appears as if many participants tried out the system on level zero after entering the museum and slowly stopped using the PDA further on in the building.
Surprisingly, the age of the participants did not influence the usage. We expected that the young participants who are more familiar with computers and PDAs would use the system more. But the elderly people used the system just as much. Some elderly museum visitors even mentioned that they preferred the PDA tour over normal audio tours since they were not able to hear well. Elderly people with poor vision usually do not come to the museums since they cannot see the art objects, but elderly people with hearing problems do come. The relatively high average age of 46 years already indicates that the majority of the visitors, in particular during the working week, are senior citizens. The main challenge for this group of users is the small screen size of the PDA. The text information displayed on it was on the edge of what they could read. Several elderly visitors returned to the wardrobe lockers to get their reading glasses before using the PDA.
Whatever made people stop using the PDA strongly biased the measurements. Only among those who really used the system, a significant difference across the media condition could be found. Among those participants that truly used the system and accessed more than 10 art objects the audiovisual material increased their usage. Clearly, these participants preferred the audio and video material compared to the presentation of pictures and text only. This indicates that only the presentation of audio and video material justifies the use of PDAs in museums compared to traditional paper guides.
It was not possible for us to properly test if visitors who operate a PDA by themselves have a different learning experience com pared to couples that shared a PDA. The numbers of true ubiNext users was insufficient to test this hypothesis.
Even though the study was advertised in newspapers and even on TV, only 11 out of 67 people who preplanned their museum tour using the ubiNext web service actually visited the museum. It appears as if the 2-week duration of the study was too short to allow many people to preplan their tour and visit the museum in the given time frame. It is unlikely that the majority of the visitors came to the museum to use the PDA system. Instead, those people who already wanted to come to the museum anyway might have also used the ubiNext web service before. Due to the low number of participants that preplanned their tour, it was not possible for us to test if these participants had a higher learning experience com pared to the ones that did not prepare their visit.
A possible indication for the low usage of the system could be found in the qualitative feedback we received through the feedback book. The complaints of the users focused on the reliability of the service and the system’s ease of use. Several users encountered technical problems, which lead them to stop using the system. Many users also commented that the user interface was too difficult and had too many features. The ubiNext system required too much attention that they would prefer to spend on the art objects.
The PDA guides were given out free of charge, and many museum visitors might have been tempted to try out the system without really having an interest in it. It would be interesting to see how the usage of the PDAs would change if the visitors would have to pay for the usage. It can be speculated that the PDAs would be used more, but also that the visitors might be more frustrated if the system malfunctions.
Future Work
The appendix is a first attempt to visualize the paths that the visitors take through the museum. With the available data it could already be extended to also visualize the sequence in which the art objects were viewed. However, at this point in time, the visitor can choose the art object on the PDA using a pull down menu. This enables them to preview art objects before actually going there. This compromises the assumption that the visitor is standing in front of the art object when requesting information about it and hence the visualization of the visitors paths. To get more reliable data on the visitors position in the museum the pull down menu should be replaced by a number pat on which the visitors have to enter the art object’s number indicated its exhibition label. The visitors could then no longer easily preview art objects without actually standing in front of them. A reliable and valid visualization of the visitors paths through the museum could help the museum to better design their exhibition space.
References
Bartneck, C., Masuoka, A., Takahashi, T., & Fukaya, T. (2006). The Learning Experience with Electronic Museum Guides. Psychology of Aesthetics, Creativity, and the Arts, (0)1, 18-25. | DOI: 10.1037/1931-3896.S.1.18
Falk, J. H., & Dierking, L. D. (2000). Learning from museums: Visitor
experiences and the making of meaning. Walnut Creek, CA: AltaMira
Press. | view at Amazon.com
Smith, J. K., & Smith, L. F. (2003). Origins of impressionism: Relating visitor behavior to perceived learning. Bulletin of Psychology and the Arts, 4(2), 80–85.
Appendix
This is a pre-print version | last updated February 5, 2008 | All Publications